
6.2.1


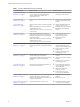
Table Of Contents
- VMware vRealize Operations for Horizon Administration
- Contents
- VMware vRealize Operations for Horizon Administration
- Monitoring Your Horizon Environment
- Using the Horizon Dashboards
- Introducing the Horizon Dashboards
- Horizon Overview Dashboard
- Horizon Infrastructure Dashboard
- Horizon User Sessions Dashboard
- Horizon VDI Pools Dashboard
- Horizon RDS Pools Dashboard
- Horizon Applications Dashboard
- Horizon Desktop Usage Dashboard
- Retrieve In Guest Process Data for Desktop Sessions
- Horizon User Session Details Dashboard
- Retrieve In-Guest Process Data for Session Objects
- View RDS Host Details Dashboard
- Retrieve In-Guest Process Data for Host Objects
- Horizon Adapter Self Health Dashboard
- Horizon End User Experience Dashboard
- Using the Horizon Reports
- Using the Horizon Dashboards
- Maintaining vRealize Operations for Horizon
- Troubleshooting a vRealize Operations for Horizon Installation
- Create a vRealize Operations Manager Support Bundle
- Download vRealize Operations for Horizon Broker Agent Log Files
- Download vRealize Operations for Horizon Desktop Agent Log Files
- View the Collection State and Status of a Horizon Adapter Object
- Horizon Collector and Horizon Adapter Log Files
- Modify the Logging Level for Horizon Adapter Log Files
- Index

Monitoring Your Horizon
Environment 1
When you install the vRealize Operations for Horizon solution, precongured Horizon dashboards and
predened Horizon report templates appear in the vRealize Operations Manager user interface. You can use
these Horizon-specic dashboards and reports along with the standard vRealize Operations Manager object
monitoring features to monitor your Horizon environment.
This chapter includes the following topics:
n
“Using the Horizon Dashboards,” on page 7
n
“Using the Horizon Reports,” on page 17
Using the Horizon Dashboards
The Horizon dashboards are in the Horizon group in the Dashboard List menu in the
vRealize Operations Manager user interface.
Most Horizon dashboards contain at least one master (or providing) widget and several receiving widgets.
Master widgets provide data to receiving widgets, and receiving widgets update the data they display
depending on the information they receive from master widgets.
The widgets on the Horizon dashboards are created from standard vRealize Operations Manager widgets. If
your user account has the necessary access rights, you can modify the Horizon dashboards and widgets or
create your own Horizon dashboards.
For information about creating and modifying dashboards and customizing widgets, see the
vRealize Operations Manager Customization and Administration Guide.
Introducing the Horizon Dashboards
You can use the precongured Horizon dashboards to monitor the performance of your Horizon
environment.
Table 1‑1. Horizon Dashboard Summary
Horizon Dashboard What It Shows When To Use It
“Horizon Overview
Dashboard,” on page 9
Status of your end-to-end Horizon
environment, including the top Horizon-
related alerts.
n
Assess Horizon pod usage, client
performance, and the overall
user experience
n
View the top Horizon-related
alerts
“Horizon Infrastructure
Dashboard,” on page 9
Information about the health, workload, and
connectivity of infrastructure hosts, remote
desktops, datastores, and RDS hosts in your
Horizon environment.
n
Understand the relationships
between objects in your Horizon
infrastructure
n
Assess the underlying vSphere
and Horizon infrastructure
VMware, Inc. 7