
5.2

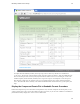

Table Of Contents
- Getting Started with vFabric Suite
- Table of Contents
- 1. About Getting Started with vFabric Suite
- 2. Quick Start Guide
- 3. Overview of vFabric Suite 5.2
- vFabric Suite Editions and Components
- vFabric Administration Server for Easier Component Management
- Simplified VM-Based Licensing Model
- vFabric Suite Product Integration and vSphere Integration
- Engineered for Spring-Built Applications
- VMware Support for Apache Tomcat, Apache HTTP Server, and RabbitMQ
- 4. vFabric Licensing
- 5. Installing vFabric Suite
- Install vFabric License Server on Your vCenter Server
- Activate vFabric Suite Licenses
- RHEL: Example Walkthrough of Installing Component From the VMware RPM Repository
- Windows/Linux: Example Walkthrough of Installing Component from Download Page
- RHEL: Optionally Configure VM to Track Open-Source Software Component Usage
- Upgrade vFabric License Server
- Uninstall vFabric License Server from vCenter Server
- 6. Monitoring vFabric License Usage

Monitoring vFabric License Usage 39
39
Option Description
You can specify only one of the following options: -group, -cluster, -datacenter, or -resourcePool.
-resourcePool
resourcePool-name
Displays periodic usage information for the specified resource pool.
You can specify only one of the following options: -group, -cluster, -datacenter, or -resourcePool.
-period period Specifies the period that the report covers, such as daily or monthly, during the specified date range (see previous
two entries). Valid values are:
• DAILY
• WEEKLY
• MONTHLY
• QUARTERLY (90 days)
• YEARLY
• ALL
Default value is DAILY.
Example
The following example shows how to run the usage-over-periods.bat command to display vFabric license usage over a
period of time. You must specify the start and end dates of the time period, as well as the period, such as monthly or yearly.
prompt> usage-over-periods.bat -startDate 09/01/2012 -endDate 09/30/2012 -period WEEKLY
The output will look something like the following:
Period: WEEKLY
License Key,Dates,Minimum Usage,Maximum Usage,Average Usage
123AA-123BB-123CC-123DD-123EE,"Sep 1, 2012 - Sep 7, 2012",2,4,3.1
123AA-123BB-123CC-123DD-123EE,"Sep 8, 2012 - Sep 14, 2012",2,3,2,5
123AA-123BB-123CC-123DD-123EE,"Sep 15, 2012 - Sep 21, 2012",1,1,1
123AA-123BB-123CC-123DD-123EE,"Sep 22, 2012 - Sep 28, 2012",1,1,1
123AA-123BB-123CC-123DD-123EE,"Sep 29, 2012 - Sept 30, 2012",0,1,0.64
The output shows the minimum, maximum, and average use (number of active VMs which are assigned a license) of a single
vFabric license key for each week in the month of September 2012. If you had installed additional vFabric license keys, then
these would also show up in the report.
Another example is to view the year-to-date usage of your vFabric Suite licenses. For example, if today is July 31, 2012:
prompt> usage-over-periods.bat -startDate 08/01/2011 -endDate 07/31/2012 -period YEARLY
The output will look something like the following:
License Key,Period,Minimum Usage,Maximum Usage,Average Usage
123AA-123BB-123CC-123DD-123EE,"Aug 1, 2011 - July 31, 2012",50,75,30.5
To view the daily usage over the last 90 days and group the output by the associated resource pool, run the following command:
prompt> usage-over-periods.bat -days 90 -group resourcePool
versions-over-periods.bat
Displays a report of the virtual machines that have run each vFabric component included in vFabric Suite over a period of time.
The report includes the minimum, maximum, and average number of virtual machines over the specified time period. By default,
the command displays information for the entire vCenter Server.