
1.1


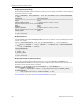


Table Of Contents
- Contents
- About the SQLFire User's Guide
- Supported Configurations and System Requirements
- Getting Started with vFabric SQLFire
- Managing Your Data in vFabric SQLFire
- Designing vFabric SQLFire Databases
- Using Server Groups to Manage Data
- Partitioning Tables
- Replicating Tables
- Estimating Memory Requirements
- Using Disk Stores to Persist Data
- Exporting and Importing Data with vFabric SQLFire
- Using Table Functions to Import Data as a SQLFire Tables
- Developing Applications with SQLFire
- Starting SQLFire Servers with the FabricServer Interface
- Developing Java Clients and Peers
- Configuring SQLFire as a JDBC Datasource
- Storing and Loading JAR Files in SQLFire
- Developing ADO.NET Client Applications
- About the ADO.NET Driver
- ADO.NET Driver Classes
- Installing and Using the ADO.NET driver
- Connecting to SQLFire with the ADO.NET Driver
- Managing Connections
- Executing SQL Commands
- Working with Result Sets
- Storing a Table
- Storing Multiple Tables
- Specifying Command Parameters with SQLFParameter
- Updating Row Data
- Adding Rows to a Table
- Managing SQLFire Transactions
- Performing Batch Updates
- Generic Coding with the SQLFire ADO.NET Driver
- Using SQLFire.NET Designer
- Understanding the Data Consistency Model
- Using Distributed Transactions in Your Applications
- Using Data-Aware Stored Procedures
- Using the Procedure Provider API
- Using the Custom Result Processor API
- Programming User-Defined Types
- Using Result Sets and Cursors
- Caching Data with vFabric SQLFire
- Deploying vFabric SQLFire
- SQLFire Deployment Models
- Steps to Plan and Configure a Deployment
- Configuring Discovery Mechanisms
- Starting and Configuring SQLFire Servers
- Configuring Multi-site (WAN) Deployments
- Configuring Authentication and Authorization
- Configuring User Authentication
- User Names in Authentication and Authorization
- Configuring User Authorization
- Configuring Network Encryption and Authentication with SSL/TLS
- Managing and Monitoring vFabric SQLFire
- Configuring and Using SQLFire Log Files
- Querying SQLFire System Tables and Indexes
- Evaluating Query Plans and Query Statistics
- Overriding Optimizer Choices
- Evaluating System and Application Performance
- Using Java Management Extensions (JMX)
- Best Practices for Tuning Performance
- Detecting and Handling Network Segmentation ("Split Brain")
- vFabric SQLFire Reference
- Configuration Properties
- JDBC API
- Mapping java.sql.Types to SQL Types
- java.sql.BatchUpdateException Class
- java.sql.Connection Interface
- java.sql.DatabaseMetaData Interface
- java.sql.Driver Interface
- java.sql.DriverManager.getConnection Method
- java.sql.PreparedStatement Interface
- java.sql.ResultSet Interface
- java.sql.SavePoint Class
- java.sql.SQLException Class
- java.sql.Statement Class
- javax.sql.XADataSource
- sqlf Launcher Commands
- sqlf backup
- sqlf compact-all-disk-stores
- sqlf compact-disk-store
- sqlf encrypt-password
- sqlf install-jar
- sqlf list-missing-disk-stores
- sqlf locator
- sqlf Logging Support
- sqlf merge-logs
- sqlf remove-jar
- sqlf replace-jar
- sqlf revoke-missing-disk-store
- sqlf server
- sqlf show-disk-store-metadata
- sqlf shut-down-all
- sqlf stats
- sqlf upgrade-disk-store
- sqlf validate-disk-store
- sqlf version
- sqlf write-data-dtd-to-file
- sqlf write-data-to-db
- sqlf write-data-to-xml
- sqlf write-schema-to-db
- sqlf write-schema-to-sql
- sqlf write-schema-to-xml
- sqlf Interactive Commands
- absolute
- after last
- async
- autocommit
- before first
- close
- commit
- connect
- connect client
- connect peer
- describe
- disconnect
- driver
- elapsedtime
- execute
- exit
- first
- get scroll insensitive cursor
- GetCurrentRowNumber
- help
- last
- LocalizedDisplay
- MaximumDisplayWidth
- next
- prepare
- previous
- protocol
- relative
- remove
- rollback
- run
- set connection
- show
- wait for
- SQLFire API
- SQL Language Reference
- Keywords and Identifiers
- SQL Statements
- ALTER TABLE
- CALL
- CREATE Statements
- DECLARE GLOBAL TEMPORARY TABLE
- DELETE
- EXPLAIN
- DROP statements
- GRANT
- INSERT
- REVOKE
- SELECT
- SET ISOLATION
- SET SCHEMA
- TRUNCATE TABLE
- UPDATE
- SQL Queries
- SQL Clauses
- SQL Expressions
- JOIN Operations
- Built-in Functions
- Standard Built-in Functions
- Aggregates (set functions)
- ABS or ABSVAL function
- ACOS function
- ASIN function
- ATAN function
- ATAN2 function
- AVG function
- BIGINT function
- CASE expressions
- CAST function
- CEIL or CEILING function
- CHAR function
- COALESCE function
- Concatenation operator
- COS function
- COSH function
- COT function
- COUNT function
- COUNT(*) function
- CURRENT DATE function
- CURRENT_DATE function
- CURRENT ISOLATION function
- CURRENT_ROLE function
- CURRENT SCHEMA function
- CURRENT TIME function
- CURRENT_TIME function
- CURRENT TIMESTAMP function
- CURRENT_TIMESTAMP function
- CURRENT_USER function
- DATE function
- DAY function
- DEGREES function
- DOUBLE function
- EXP function
- FLOOR function
- HOUR function
- INTEGER function
- LCASE or LOWER function
- LENGTH function
- LN or LOG function
- LOG10 function
- LOCATE function
- LTRIM function
- MAX function
- MIN function
- MINUTE function
- MOD function
- MONTH function
- NULLIF expressions
- PI function
- RADIANS function
- RANDOM function
- RAND function
- RTRIM function
- SECOND function
- SESSION_USER function
- SIGN function
- SIN function
- SINH function
- SMALLINT function
- SQRT function
- SUBSTR function
- SUM function
- TAN function
- TANH function
- TIME function
- TIMESTAMP function
- TRIM function
- UCASE or UPPER function
- USER function
- VARCHAR function
- XMLEXISTS operator
- XMLPARSE operator
- XMLQUERY operator
- XMLSERIALIZE operator
- YEAR function
- SQLFire Built-in Functions
- Standard Built-in Functions
- Built-in System Procedures
- Standard Built-in Procedures
- SYSCS_UTIL.EMPTY_STATEMENT_CACHE
- SYSCS_UTIL.EXPORT_QUERY
- SYSCS_UTIL.EXPORT_TABLE
- SYSCS_UTIL.IMPORT_DATA
- SYSCS_UTIL.IMPORT_DATA_EX
- SYSCS_UTIL.IMPORT_DATA_LOBS_FROM_EXTFILE system procedure
- SYSCS_UTIL.IMPORT_TABLE
- SYSCS_UTIL.IMPORT_TABLE_EX
- SYSCS_UTIL.IMPORT_TABLE_LOBS_FROM_EXTFILE
- SYSCS_UTIL.SET_EXPLAIN_CONNECTION
- SYSCS_UTIL.SET_STATISTICS_TIMING
- JAR Installation Procedures
- Callback Configuration Procedures
- Heap Eviction Configuration Procedures
- WAN Configuration Procedures
- Standard Built-in Procedures
- Data Types
- SQL Standards Conformance
- System Tables
- ASYNCEVENTLISTENERS
- GATEWAYRECEIVERS
- GATEWAYSENDERS
- INDEXES
- JARS
- MEMBERS
- MEMORYANALYTICS
- STATEMENTPLANS
- SYSALIASES
- SYSCHECKS
- SYSCOLPERMS
- SYSCOLUMNS
- SYSCONGLOMERATES
- SYSCONSTRAINTS
- SYSDEPENDS
- SYSDISKSTORES
- SYSFILES
- SYSFOREIGNKEYS
- SYSKEYS
- SYSROLES
- SYSROUTINEPERMS
- SYSSCHEMAS
- SYSSTATEMENTS
- SYSSTATISTICS
- SYSTABLEPERMS
- SYSTABLES
- SYSTRIGGERS
- SYSVIEWS
- Exception Messages and SQL States
- ADO.NET Driver Reference
- SQLFire Data Types in ADO.NET
- VMware.Data.SQLFire.BatchUpdateException
- VMWare.Data.SQLFire.SQLFClientConnection
- VMware.Data.SQLFire.SQLFCommand
- VMware.Data.SQLFire.SQLFCommandBuilder
- VMware.Data.SQLFire.SQLFType
- VMware.Data.SQLFire.SQLFDataAdapter
- VMware.Data.SQLFire.SQLFDataReader
- VMware.Data.SQLFire.SQLFException
- VMware.Data.SQLFire.SQLFParameter
- VMware.Data.SQLFire.SQLFParameterCollection
- VMware.Data.SQLFire.SQLFTransaction
- vFabric SQLFire Limitations
- Troubleshooting Common Problems
- vFabric SQLFire Glossary
- Index

NLJOIN (2.68%) execute_time 0.378 ms returned_rows 14 no_opens 1
TABLESCAN (53.09%) execute_time 7.482 ms returned_rows 1 no_opens
1 scan_qualifiers Column[0][0] Id: FLIGHT_ID Operator: = AA1116 Ordered
nulls: false Unknown return value: false scanned_object APP.FLIGHTS
scan_type HEAP
ROWIDSCAN (1.02%) execute_time 0.144 ms returned_rows 14 no_opens
1 node_details FLIGHTAVAILABILITY :
CONSTRAINTSCAN (43.19%) execute_time 6.087 ms returned_rows 14
no_opens 1 scan_qualifiers None scanned_object
APP.6__FLIGHTAVAILABILITY__FLIGHT_ID__SEGMENT_NUMBER:base-table:APP.FLIGHTAVAILABILITY
scan_type node_details WHERE : ((F.FLIGHT_ID = FA.FLIGHT_ID) and true)
The top of the query plan output displays the statement ID and the original text of the query itself. The body
of the plan is divided into two main sections identified by the query plan codes QUERY-SCATTER and
QUERY-RECEIVE. Each section contains indented rows showing nested tasks. Because each task feeds
into the task above it, you should read the query plan starting with the bottom, most-nested task in each
section. Individual task rows show the task execution time in milliseconds, as well as the overall percentage
of time spent completing that task relative to all of the tasks in the section, combined.
For example, QUERY-SCATTER includes all of the tasks associated with delivering the query from the
query coordinator to one or more data stores in the cluster, and then receiving and processing results on the
query coordinator. This example uses a single data store member to provide all results, so very little time is
spent on the query coordinator after the DISTRIBUTION-END phase (which represents 97% of the time
required to distribute, receive, and process the results). When data is distributed across multiple data stores
(for partitioned and/or replicated tables) additional time will be spent on the query coordinator to merge the
results from each data store.
The QUERY-RECEIVE section of the plan describes the query processing tasks that a data store member
takes in order to execute a query. This header displays the member ID and process ID of the data store, as
well as the total aggregate time for all of the subordinate tasks. If the query is distributed to multiple data
store members, then each member will display a separate QUERY-RECEIVE section. Each section should
be identical, unless tables are partitioned across different sets of machines of VMs.
The example shows that a nested loop join (NLJOIN) is performed in order to produce the results. NLJOIN
always has two nested subtasks that represent the outer and inner tables in the join. In this example, a
TABLESCAN is first performed on the FLIGHTS table, which holds the foreign key FLIGHT_ID. The
TABLESCAN returns a single row. The inner table then uses the results of the TABLESCAN in a
CONSTRAINTSCAN performed on the FLIGHTAVAILABILITY table.
Table scans are very expensive operations in query processing, and even this quick query of a small data set
shows that the majority of the time (53% of the query execution time) was spent scanning the FLIGHTS
table. The remaining steps show how creating an index changes the query plan and improves performance.
8. To avoid the costly table scan used in the sample query, execute the following command to create an index
on the FLIGHT_ID column of the FLIGHTS table:
CREATE INDEX fa_index ON flights (flight_id);
9. Re-run the query, creating a new query plan. Then examine the new plan:
explain select * from flights f, flightavailability fa where
f.flight_id=fa.flight_id and f.flight_id='AA1116';
select STMT_ID, STMT_TEXT from SYS.STATEMENTPLANS;
explain '00000001-ffff-ffff-ffff-00010000051e';
You should receive output similar to:
stmt_id 00000001-ffff-ffff-ffff-00010000051e SQL_stmt select * from
flights f, flightavailability fa where f.flight_id=fa.flight_id and
f.flight_id=<?> begin_execution 2013-01-30 15:33:46.857 end_execution
2013-01-30 15:33:46.878
vFabric SQLFire User's Guide270
Managing and Monitoring vFabric SQLFire