
1.1.1
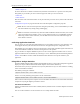

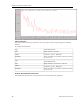
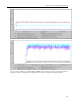
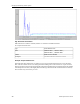
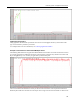
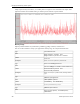

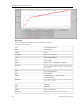
Table Of Contents
- Contents
- About the SQLFire User's Guide
- Supported Configurations and System Requirements
- Getting Started with vFabric SQLFire
- Managing Your Data in vFabric SQLFire
- Designing vFabric SQLFire Databases
- Using Server Groups to Manage Data
- Partitioning Tables
- Replicating Tables
- Estimating Memory Requirements
- Using Disk Stores to Persist Data
- Exporting and Importing Data with vFabric SQLFire
- Using Table Functions to Import Data as a SQLFire Tables
- Developing Applications with SQLFire
- Starting SQLFire Servers with the FabricServer Interface
- Developing Java Clients and Peers
- Configuring SQLFire as a JDBC Datasource
- Using SQLFire with Hibernate
- Storing and Loading JAR Files in SQLFire
- Developing ADO.NET Client Applications
- About the ADO.NET Driver
- ADO.NET Driver Classes
- Installing and Using the ADO.NET driver
- Connecting to SQLFire with the ADO.NET Driver
- Managing Connections
- Executing SQL Commands
- Working with Result Sets
- Storing a Table
- Storing Multiple Tables
- Specifying Command Parameters with SQLFParameter
- Updating Row Data
- Adding Rows to a Table
- Managing SQLFire Transactions
- Performing Batch Updates
- Generic Coding with the SQLFire ADO.NET Driver
- Using SQLFire.NET Designer
- Understanding the Data Consistency Model
- Using Distributed Transactions in Your Applications
- Using Data-Aware Stored Procedures
- Using the Procedure Provider API
- Using the Custom Result Processor API
- Programming User-Defined Types
- Using Result Sets and Cursors
- Caching Data with vFabric SQLFire
- Deploying vFabric SQLFire
- SQLFire Deployment Models
- Steps to Plan and Configure a Deployment
- Configuring Discovery Mechanisms
- Starting and Configuring SQLFire Servers
- Configuring Multi-site (WAN) Deployments
- Configuring Authentication and Authorization
- Configuring User Authentication
- User Names in Authentication and Authorization
- Configuring User Authorization
- Configuring Network Encryption and Authentication with SSL/TLS
- Managing and Monitoring vFabric SQLFire
- Configuring and Using SQLFire Log Files
- Querying SQLFire System Tables and Indexes
- Evaluating Query Plans and Query Statistics
- Overriding Optimizer Choices
- Evaluating System and Application Performance
- Using Java Management Extensions (JMX)
- Best Practices for Tuning Performance
- Detecting and Handling Network Segmentation ("Split Brain")
- vFabric SQLFire Reference
- Configuration Properties
- JDBC API
- Mapping java.sql.Types to SQL Types
- java.sql.BatchUpdateException Class
- java.sql.Connection Interface
- java.sql.DatabaseMetaData Interface
- java.sql.Driver Interface
- java.sql.DriverManager.getConnection Method
- java.sql.PreparedStatement Interface
- java.sql.ResultSet Interface
- java.sql.SavePoint Class
- java.sql.SQLException Class
- java.sql.Statement Class
- javax.sql.XADataSource
- sqlf Launcher Commands
- sqlf backup
- sqlf compact-all-disk-stores
- sqlf compact-disk-store
- sqlf encrypt-password
- sqlf install-jar
- sqlf list-missing-disk-stores
- sqlf locator
- sqlf Logging Support
- sqlf merge-logs
- sqlf remove-jar
- sqlf replace-jar
- sqlf revoke-missing-disk-store
- sqlf run
- sqlf server
- sqlf show-disk-store-metadata
- sqlf shut-down-all
- sqlf stats
- sqlf upgrade-disk-store
- sqlf validate-disk-store
- sqlf version
- sqlf write-data-dtd-to-file
- sqlf write-data-to-db
- sqlf write-data-to-xml
- sqlf write-schema-to-db
- sqlf write-schema-to-sql
- sqlf write-schema-to-xml
- sqlf Interactive Commands
- absolute
- after last
- async
- autocommit
- before first
- close
- commit
- connect
- connect client
- connect peer
- describe
- disconnect
- driver
- elapsedtime
- execute
- exit
- first
- get scroll insensitive cursor
- GetCurrentRowNumber
- help
- last
- LocalizedDisplay
- MaximumDisplayWidth
- next
- prepare
- previous
- protocol
- relative
- remove
- rollback
- run
- set connection
- show
- wait for
- SQLFire API
- SQL Language Reference
- Keywords and Identifiers
- SQL Statements
- ALTER TABLE
- CALL
- CREATE Statements
- DECLARE GLOBAL TEMPORARY TABLE
- DELETE
- EXPLAIN
- DROP statements
- GRANT
- INSERT
- REVOKE
- SELECT
- SET ISOLATION
- SET SCHEMA
- TRUNCATE TABLE
- UPDATE
- SQL Queries
- SQL Clauses
- SQL Expressions
- JOIN Operations
- Built-in Functions
- Standard Built-in Functions
- Aggregates (set functions)
- ABS or ABSVAL function
- ACOS function
- ASIN function
- ATAN function
- ATAN2 function
- AVG function
- BIGINT function
- CASE expressions
- CAST function
- CEIL or CEILING function
- CHAR function
- COALESCE function
- Concatenation operator
- COS function
- COSH function
- COT function
- COUNT function
- COUNT(*) function
- CURRENT DATE function
- CURRENT_DATE function
- CURRENT ISOLATION function
- CURRENT_ROLE function
- CURRENT SCHEMA function
- CURRENT TIME function
- CURRENT_TIME function
- CURRENT TIMESTAMP function
- CURRENT_TIMESTAMP function
- CURRENT_USER function
- DATE function
- DAY function
- DEGREES function
- DOUBLE function
- EXP function
- FLOOR function
- HOUR function
- INTEGER function
- LCASE or LOWER function
- LENGTH function
- LN or LOG function
- LOG10 function
- LOCATE function
- LTRIM function
- MAX function
- MIN function
- MINUTE function
- MOD function
- MONTH function
- NULLIF expressions
- PI function
- RADIANS function
- RANDOM function
- RAND function
- RTRIM function
- SECOND function
- SESSION_USER function
- SIGN function
- SIN function
- SINH function
- SMALLINT function
- SQRT function
- SUBSTR function
- SUM function
- TAN function
- TANH function
- TIME function
- TIMESTAMP function
- TRIM function
- UCASE or UPPER function
- USER function
- VARCHAR function
- XMLEXISTS operator
- XMLPARSE operator
- XMLQUERY operator
- XMLSERIALIZE operator
- YEAR function
- SQLFire Built-in Functions
- Standard Built-in Functions
- Built-in System Procedures
- Standard Built-in Procedures
- SYSCS_UTIL.EMPTY_STATEMENT_CACHE
- SYSCS_UTIL.EXPORT_QUERY
- SYSCS_UTIL.EXPORT_TABLE
- SYSCS_UTIL.IMPORT_DATA
- SYSCS_UTIL.IMPORT_DATA_EX
- SYSCS_UTIL.IMPORT_DATA_LOBS_FROM_EXTFILE system procedure
- SYSCS_UTIL.IMPORT_TABLE
- SYSCS_UTIL.IMPORT_TABLE_EX
- SYSCS_UTIL.IMPORT_TABLE_LOBS_FROM_EXTFILE
- SYSCS_UTIL.SET_EXPLAIN_CONNECTION
- SYSCS_UTIL.SET_STATISTICS_TIMING
- JAR Installation Procedures
- Callback Configuration Procedures
- Heap Eviction Configuration Procedures
- WAN, Statistics, and User Configuration Procedures
- Standard Built-in Procedures
- Data Types
- SQL Standards Conformance
- System Tables
- ASYNCEVENTLISTENERS
- GATEWAYRECEIVERS
- GATEWAYSENDERS
- INDEXES
- JARS
- MEMBERS
- MEMORYANALYTICS
- STATEMENTPLANS
- SYSALIASES
- SYSCHECKS
- SYSCOLPERMS
- SYSCOLUMNS
- SYSCONGLOMERATES
- SYSCONSTRAINTS
- SYSDEPENDS
- SYSDISKSTORES
- SYSFILES
- SYSFOREIGNKEYS
- SYSKEYS
- SYSROLES
- SYSROUTINEPERMS
- SYSSCHEMAS
- SYSSTATEMENTS
- SYSSTATISTICS
- SYSTABLEPERMS
- SYSTABLES
- SYSTRIGGERS
- SYSVIEWS
- Exception Messages and SQL States
- ADO.NET Driver Reference
- SQLFire Data Types in ADO.NET
- VMware.Data.SQLFire.BatchUpdateException
- VMWare.Data.SQLFire.SQLFClientConnection
- VMware.Data.SQLFire.SQLFCommand
- VMware.Data.SQLFire.SQLFCommandBuilder
- VMware.Data.SQLFire.SQLFType
- VMware.Data.SQLFire.SQLFDataAdapter
- VMware.Data.SQLFire.SQLFDataReader
- VMware.Data.SQLFire.SQLFException
- VMware.Data.SQLFire.SQLFParameter
- VMware.Data.SQLFire.SQLFParameterCollection
- VMware.Data.SQLFire.SQLFTransaction
- vFabric SQLFire Limitations
- Troubleshooting Common Problems
- vFabric SQLFire Glossary
- Index

• statistic-sample-rate
To collect statement-level statistics and time-based, statement-level statistics for a specific connection (rather
than globally or per-member), use these connection properties with a peer client connection:
• enable-stats
• enable-timestats
Note that enable-stats and enable-timestats can only be used with a peer client connect, and not with a thin client
connection.
Configuration Properties on page 319 describes these and other SQLFire configuration properties.
Note: Because of the overhead required for taking many timestamps, it is recommended that you enable
time-based statistics only during testing and debugging.
Note: Use statement-level statistics only when the number of individual statements is small, such as when
using prepared statements. SQLFire creates a separate statistics instance for each individual statement.
With a large number of these statements, it can be difficult to load archives into VSD and navigate to
those statistics of interest.
Collecting Application Statistics
You can collect your own application-defined statistics to record anything of interest to your application, such
as throughput and latency for multi-statement transactions and application-specific configuration values.
This capability gives you complete control over what to measure. It also makes it possible to gather statement-level
or time-based statistics without the overhead of turning them on in the product.
Any peer member of a SQLFire distributed system can collect and use application statistics. You can also use
application statistics from non-members by connecting to a "loner" distributed system before defining statistics.
Statistics in the VMware vFabric Gemfire documentation describes how to incorporate statistics in your
application.
Using VSD to Analyze Statistics
The Visual Statistics Display (VSD) reads the sampled statistics from one or more archives and produces graphical
displays for analysis. VSD is installed with vFabric SQLFire in the tools subdirectory.
The statistics values (Y-axis) are plotted over time (X-axis). This makes it easy to see how statistics are trending,
and to correlate different statistics.
Start VSD by entering the command:
<SQLFireInstallDir>/bin/vsd/bin/vsd
Archives are usually loaded by passing them in on the command line:
<SQLFireInstallDir>/bin/vsd/bin/vsd <archiveFileName> …
VSD’ s extensive online help offers complete reference information about the tool. The sections that follow show
examples of analyzing the SQLFire performance metrics.
Transaction Performance
SQLFire provides statistics for transaction commits, rollbacks, and failures You can monitor SQLFire transactions
with VSD.
You can use these statistics to see the transaction rate. An example follows the table.
vFabric SQLFire User's Guide284
Managing and Monitoring vFabric SQLFire