
User`s guide
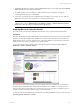
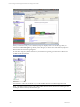
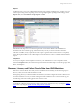
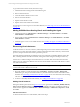
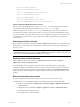
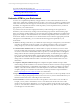
Table Of Contents
- VCM Installation and Getting Started Guide
- Updated Information
- About This Book
- Preparing for Installation
- Installing VCM
- Using Installation Manager
- Installing and Configuring the OS Provisioning Server and Components
- Installing the Operating System Provisioning Server
- Preparing Boot Images for Windows Provisioning
- Copy the VCM Certificate to the OS Provisioning Server for Linux Provisioning
- Importing Distributions into the OS Provisioning Server Repository
- Configuring the OS Provisioning Server Integration with the VCM Collector
- Maintaining Operating System Provisioning Servers
- Upgrading or Migrating vCenter Configuration Manager
- Upgrade and Migration Scenarios
- Prerequisites
- Back up Your Databases
- Back up Your Files
- Back up Your Certificates
- Software Supported by the VCM Collector
- Migration Process
- Prerequisites
- Foundation Checker Must Run Successfully
- Use the SQL Migration Helper Tool
- Migrate Only Your Database
- Replace your existing 32-Bit Environment with the Supported 64-bit Environment
- How to Recover Your Machine if the Migration is not Successful
- Migrate a 32-bit environment running VCM 5.3 or earlier to VCM 5.4
- Migrate a 64-bit environment running VCM 5.3 or earlier to VCM 5.4
- Migrate a split installation of VCM 5.3 or earlier to a single-server install...
- After You Migrate VCM
- Upgrade Process
- Upgrading Existing Windows Agents
- Upgrading Existing Remote Clients
- Upgrading Existing UNIX Agents
- Upgrading VCM for Virtualization
- Getting Started with VCM Components and Tools
- Getting Started with VCM
- Discover, License, and Install Windows Machines
- Verifying Available Domains
- Checking the Network Authority
- Assigning Network Authority Accounts
- Discovering Windows Machines
- Licensing Windows Machines
- Installing the VCM Windows Agent on your Windows Machines
- Performing an Initial Collection
- Exploring Windows Collection Results
- Getting Started Collecting Windows Custom Information
- Discover, License, and Install UNIX/Linux Machines
- Discover, License, and Install Mac OS X Machines
- Discover, License, and Collect Oracle Data from UNIX Machines
- Customize VCM for your Environment
- How to Set Up and Use VCM Auditing
- Discover, License, and Install Windows Machines
- Getting Started with VCM for Virtualization
- Getting Started with VCM Remote
- Getting Started with VCM Patching
- Getting Started with Operating System Provisioning
- Getting Started with Software Provisioning
- Getting Started with VCM Management Extensions for Assets
- Getting Started with VCM Service Desk Integration
- Getting Started with VCM for Active Directory
- Accessing Additional Compliance Content
- Installing and Getting Started with VCM Tools
- Maintaining VCM After Installation
- Troubleshooting Problems with VCM
- Index

4. The Data Types dialog box appears. Select the Select All check box, then confirm that the Use default
filters option button is also selected. Click Next.
5. For initial collections, there should be no conflicts with previously scheduled or running jobs
containing the same data types. Click Finish.
6. Verify that your collection job has completed before proceeding to the next step. To do so, click the
Jobs button at the top of the Portal window to access the Jobs Summary.
NOTE You can also verify jobs for the past 24 hours if you think that you may have missed your
collection job by going to Administration > Job Manager > History > Instant Collections > Past 24
Hours. Refer to the online Help for additional detail regarding Jobs.
Exploring Mac OS X Collection Results
Now that you have performed an initial Mac OS X collection, you can explore that data in the Portal.
Dashboards
Mac OS X data is displayed in the UNIX Dashboards. Each Dashboard is run only when the node is selected
against the current data available in the CMDB for the machines in the active machine group. Therefore,
Dashboard data is only current as of the time it was collected. In addition, it may take time for the data to
display based on the volume or complexity of the data requested.
To view Mac OS data, begin by looking at the UNIX Operating System Dashboard under Console >
Dashboards > UNIX > Operating Systems.
Note that several other UNIX Dashboards are also available. Take time to familiarize yourself with the
remainder of the UNIX Dashboards. UNIX Collection Results are also available to you in a more “raw”
format as well. This level of reporting is more relevant for day-to-day operations, troubleshooting, and
analysis, and can be viewed in a Summary report or data grid format.
Look at your Mac OS X Operating System information by clicking the UNIX tab in the Console. Then, click
Operating System > Machines > General.
Getting Started with VCM
VMware, Inc. 121