
Virtual Private Cloud OnDemand User's Guide
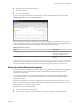
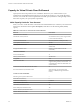
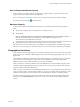
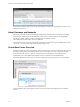
Table Of Contents
- vCloud Air - Virtual Private Cloud OnDemand User's Guide
- Contents
- About This User's Guide
- Introducing Virtual Private Cloud OnDemand
- Navigating Virtual Private Cloud OnDemand
- Working with Virtual Machines
- Virtual Machine Overview
- Overview of Storage Tiers
- vApp Overview
- End User Virtual Machine Access
- Sort and View Virtual Machines
- Create a Virtual Machine from a Template
- Create a Virtual Machine Without Using a Template
- Virtual Machine Power Operations
- Edit Virtual Machine Properties
- Adjust Virtual Machine Resources
- Add a Disk to a Virtual Machine
- Set Storage and Runtime Leases for a vApp
- Manage Virtual Machine Properties in vCloud Director
- Connect a Virtual Machine to a Network
- Change Network Assignments for a Virtual Machine
- Connect a Virtual Machine to the Internet
- Log Into a Virtual Machine Guest OS with the Console
- Virtual Machine Monitoring
- Work with Virtual Machine Snapshots
- Managing Your Public Cloud Environment
- Capacity for Virtual Private Cloud OnDemand
- Geographical Locations
- About Gateways and Networks
- Virtual Data Center Overview
- Create a Virtual Data Center
- Edit or Delete a Virtual Data Center
- Virtual Data Center Permissions
- Catalogs and Templates Overview
- Manage Catalogs in vCloud Director
- Role-based User Account Management
- Add a User to Your Service
- Edit User Details
- Delete a User from Your Service
- Reset a User's Password
- Managing User Groups
- Metering Resource Usage
- Index

n
Analyses trends for discrete time periods
n
Monitors performance
n
Provides troubleshooting
To view monitoring information for a virtual machine, click the virtual machine name in the list on the
Virtual Machines tab; then, select the Monitoring tab.
Click the refresh icon to make sure that the most recent data is displayed. View the past 24 hours, 7 days, or
14 days' usage. The left-hand Y axis for percentage data is fixed between 0-100%, while the right-hand Y axis
for raw usage scales with the historical usage data of the individual virtual machine .
Table 3‑2. Monitoring Graphs
Graph Description
CPU Usage View by percentage or by raw data as
MHz units by clicking the controls.
The displays toggle on and off.
Memory Usage View by percentage or by raw data as
GB units.
Additionally, you can obtain virtual machine monitoring data programmatically by using the vCloud API.
See About Virtual Machine Metrics in the vCloud API Programming Guide for vCloud Air Tenants Guide.
Work with Virtual Machine Snapshots
In Virtual Private Cloud OnDemand, a snapshot captures a reproduction of a virtual machine, including the
state of the data on all of the virtual machine's disks and whether the virtual machine is powered on,
powered off, or suspended.
You can take a snapshot when a virtual machine is powered on, powered off, or suspended. When you
revert a virtual machine to a snapshot, the virtual machine is reverted to the state it was in when the
snapshot was created.
Snapshots are useful when you must revert repeatedly to the same virtual machine state, but you do not
want to create multiple virtual machines. VMware recommends that you do not use snapshots as your only
backup solution or as a long-term backup solution.
Snapshots have the following limitations:
n
They do not capture NIC configurations.
n
They cannot be created if any virtual machine in the vApp is connected to an independent disk.
Chapter 3 Working with Virtual Machines
VMware, Inc. 45