
Specifications
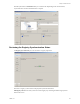
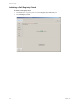
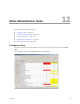
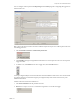
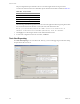
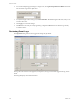
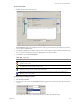
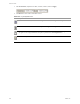
Table Of Contents
- Reference Guide
- Contents
- About This Book
- Getting Started
- Installation
- vCenter Server Heartbeat Implementation
- vCenter Server Heartbeat Installation on Windows Server 2003
- vCenter Server Heartbeat Installation on Windows Server 2008
- Configuring vCenter Server Heartbeat
- Server Configuration Wizard
- Configuring the Machine Identity
- Configuring the Server Role
- Configuring the Client Connection Port
- Configuring Channel IP Routing
- Configuring the Default Channel Port
- Configuring Low Bandwidth Module
- Configuring Public IP Addressing
- Enabling Network Monitoring
- Configuring Split-Brain Avoidance
- Managing vCenter Server Heartbeat License Keys
- Configuring Message Queue Logs
- Configuring the Maximum Disk Usage
- System Administration and Management
- Server Protection
- Network Protection
- Application Protection
- Status and Control
- Performance Protection
- Data Protection
- Data Protection Overview
- Other Administrative Tasks
- Troubleshooting
- Troubleshooting Unexpected Behaviors
- Two Active Servers
- Two Passive Servers
- Synchronization Failures
- Registry Status is Out of Sync
- Channel Drops
- Subnet or Routing Issues
- MaxDiskUsage Errors
- MaxDiskUsage Error Messages
- [L9]Exceeded the Maximum Disk Usage (VCChannelExceededMaxDiskUsageException)
- [L9]Exceeded the Maximum Disk Usage on the ACTIVE Server
- [L9]Exceeded the Maximum Disk Usage on the PASSIVE Server
- [L20]Out of Disk Space (VCChannelOutOfDiskSpaceException)
- Application Slowdown
- Poor Application Performance
- Both Servers Can Accommodate the Initial Load but the Load Has Increased
- One Server Can Provide Adequate Resource Support, but the Other Cannot
- Scheduled Resource Intensive Tasks
- Appendix - Setup Error Messages
- Glossary

VMware, Inc. 179
Chapter 12 Other Administrative Tasks
To review the details
1 Double-click the entry in the data grid.
Event Properties displays the full detail and trace of the log that caused the event and the source of the
error to aid in troubleshooting.
2Use the Up and Down arrows in this window to review other logs. This feature is useful where many logs
have occurred simultaneously and helps to identify the source of the problem.
3Click Close to close the Event Properties.
To display logs according to severity
1 Select Events of at Least.
2 Select the importance level and click Apply to display logged events equal to or greater than the selected
severity.
You can filter logs to display a subset of logs between a specific date and time range.
Table 12-2. Log Events
Icon Description
Errors within the underlying operation of vCenter Server Heartbeat and can be considered critical to the
operation of the system.
Warnings generated for discrepancies within the vCenter Server Heartbeat operational environment that are
not deemed critical to the operation of the system.
System logs are generated following normal vCenter Server Heartbeat operations. You can use these logs to
verify the success of processes such as file synchronization.
Information on operations within the graphical user interface rather than operations on vCenter Server
Heartbeat service, such as login.