
5.8.5

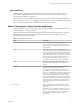
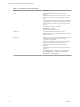
Table Of Contents
- VMware vCenter Operations Manager Getting Started Guide
- Contents
- VMware vCenter Operations Manager Getting Started Guide
- Introducing Key Features and Concepts
- Beginning to Monitor the Virtual Environment
- Object Type Icons in the Inventory Pane
- Badge Concepts for vCenter Operations Manager
- Major Badges in vCenter Operations Manager
- Working with Metrics and Charts on the All Metrics Tab
- Viewing Members and Relationships in the Monitored Environment
- Check the Performance of Your Virtual Environment
- Balancing the Resources in Your Virtual Environment
- Find an ESX Host that Has Resources for More Virtual Machines
- Find a Cluster that Has Resources Available for More Virtual Machines
- Ranking the Health, Risk, and Efficiency Scores
- View the Compliance Details
- View a List of Members
- Overview of Relationships
- Troubleshooting with vCenter Operations Manager
- Troubleshooting Overview
- Troubleshooting a Help Desk Problem
- Troubleshooting an Alert
- Finding Problems in the Virtual Environment
- Finding the Cause of the Problem
- Determine Whether the Environment Operates as Expected
- Identify the Source of Performance Degradation
- Identify the Underlying Memory Resource Problem for a Virtual Machine
- Identify the Underlying Memory Resource Problem for Clusters and Hosts
- Identify the Top Resource Consumers
- Identify Events that Occurred when an Object Experienced Performance Degradation
- Determine the Extent of a Performance Degradation
- Determine the Timeframe and Nature of a Health Issue
- Determine the Cause of a Problem with a Specific Object
- Fix the Cause of the Problem
- Assessing Risk and Efficiency in vCenter Operations Manager
- Analyzing Data for Capacity Risk
- Determine When an Object Might Run Out of Resources
- Identify Clusters with the Space for Virtual Machines
- Investigating Abnormal Host Health
- Identify Datastores with Space for Virtual Machines
- Identify Datastores with Wasted Space
- Address a Problem with a Specific Virtual Machine
- Identify the Virtual Machines with Resource Waste Across Datastores
- Address a Problem with a Specific Datastore
- Identify the Host and Datastore with the Highest Latency
- Optimizing Data for Capacity
- Determine How Efficiently You Use the Virtual Infrastructure
- Identify the Consolidation Ratio Trend for a Datacenter or Cluster
- Determine Reclaimable Resources from Underused Objects
- Assess Virtual Machine Capacity Use
- Assess Virtual Machine Optimization Data
- Identify Powered-Off Virtual Machines to Optimize Data
- Identify Idle Virtual Machines to Optimize Capacity
- Identify Oversized Virtual Machines to Optimize Data
- Determine the Trend of Waste for a Virtual Machine
- Forecasting Data for Capacity Risk
- Create Capacity Scenarios for Virtual Machines With New Profiles
- Create Capacity Scenarios for Virtual Machines With Existing Profiles
- Create a Hardware Change Scenario
- Create a What-If Scenario to Remove Virtual Machines
- Combine the Results of What-If Scenarios
- Compare the Results of What-If Scenarios
- Delete a Scenario from the What-If Scenarios List
- Analyzing Data for Capacity Risk
- Working with Faults and Alerts
- Working with Groups
- Set How Data Appears in vCenter Operations Manager
- Create a New Policy
- Set the General Parameters of a Policy
- Associate a Policy with One or More Groups
- Customize Badge Thresholds for Infrastructure Objects
- Customize Badge Thresholds for Virtual Machine Objects
- Customize the Badge Thresholds for Groups
- Modify Capacity and Time Remaining Settings
- Modify Usable Capacity Settings
- Modify Usage Calculation Settings
- Modify the Criteria for Powered-Off and Idle Virtual Machine State
- Modify the Criteria for Oversized and Undersized Virtual Machines
- Modify the Criteria for Underused and Stressed Capacity
- Select Which Badges Generate Alerts
- Modify Trend and Forecast Analysis Settings
- Modify an Existing Policy
- Modify Summary, Views, and Reports Settings
- Create a New Policy
- Monitor the Performance of vCenter Operations Manager
- Index

Alerts and Faults
vCenter Operations Manager generates alerts when events occur on the monitored objects, when data
analysis indicates deviations from normal metric values, or when a problem occurs with one of the
vCenter Operations Manager components.
Events that the vCenter Serverpublishes are the main source for faults. These events might originate in the
vCenter Server itself, or ESX servers might generate them and the vCenter Server publishes them externally.
Only a subset of vCenter events are considered as important for fault generation.
Metric Concepts for vCenter Operations Manager
Preparing to monitor your environment with vCenter Operations Manager involves some familiarity with
metrics that help you to identify a problem.
vCenter Server presents a use-based model of metrics. vCenter Operations Manager presents a demand-
based model of metrics. Some knowledge of the metrics that affect the data and graphs is useful to
determine what to do next in a workflow.
Table 1‑1. Major Metric Concepts
Metric Description
Provisioned Amount of a resource that the user configures.
The provisioned metric might apply to the amount of
physical memory for a host or the number of vCPUs for a
virtual machine.
Usable Actual amount of a resource that the object can use.
The usable amount is less than or equal to the provisioned
amount. The difference between the provisioned amount
and usable amount stems from virtualization overhead.
This overhead might include the memory that an ESX host
uses to run the host, to support reservations for virtual
machines, and to add a buffer for high availability.
The usable metric does not apply to virtual machines.
Usage Amount of a resource that an object consumes.
The usage amount is less than or equal to the usable
amount.
Demand Amount of a physical resource that the object might
consume without any existing constraints.
An object becomes constrained because of under-
provisioning or contention with other consumers of the
resource. A virtual machine might require 10GB of memory
but can only get 5GB because the virtual machine must
share resources with other virtual machines on the host.
When the demand amount is less than the usage amount,
the environment might have wasted resources. When the
demand amount is greater than the usage amount, the
environment might incur latency and exhibit decreased
performance.
Contention Difference between the amount of the resource that the
object requires and the amount of the resource that the
object gets.
This metric measures the effect of conflict for a resource
between consumers. Contention measures latency or the
amount of time it takes to gain access to a resource. This
measurement accounts for dropped packets for
networking.
Chapter 1 Introducing Key Features and Concepts
VMware, Inc. 9