
5.8.5
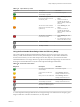
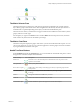

Table Of Contents
- VMware vCenter Operations Manager Getting Started Guide
- Contents
- VMware vCenter Operations Manager Getting Started Guide
- Introducing Key Features and Concepts
- Beginning to Monitor the Virtual Environment
- Object Type Icons in the Inventory Pane
- Badge Concepts for vCenter Operations Manager
- Major Badges in vCenter Operations Manager
- Working with Metrics and Charts on the All Metrics Tab
- Viewing Members and Relationships in the Monitored Environment
- Check the Performance of Your Virtual Environment
- Balancing the Resources in Your Virtual Environment
- Find an ESX Host that Has Resources for More Virtual Machines
- Find a Cluster that Has Resources Available for More Virtual Machines
- Ranking the Health, Risk, and Efficiency Scores
- View the Compliance Details
- View a List of Members
- Overview of Relationships
- Troubleshooting with vCenter Operations Manager
- Troubleshooting Overview
- Troubleshooting a Help Desk Problem
- Troubleshooting an Alert
- Finding Problems in the Virtual Environment
- Finding the Cause of the Problem
- Determine Whether the Environment Operates as Expected
- Identify the Source of Performance Degradation
- Identify the Underlying Memory Resource Problem for a Virtual Machine
- Identify the Underlying Memory Resource Problem for Clusters and Hosts
- Identify the Top Resource Consumers
- Identify Events that Occurred when an Object Experienced Performance Degradation
- Determine the Extent of a Performance Degradation
- Determine the Timeframe and Nature of a Health Issue
- Determine the Cause of a Problem with a Specific Object
- Fix the Cause of the Problem
- Assessing Risk and Efficiency in vCenter Operations Manager
- Analyzing Data for Capacity Risk
- Determine When an Object Might Run Out of Resources
- Identify Clusters with the Space for Virtual Machines
- Investigating Abnormal Host Health
- Identify Datastores with Space for Virtual Machines
- Identify Datastores with Wasted Space
- Address a Problem with a Specific Virtual Machine
- Identify the Virtual Machines with Resource Waste Across Datastores
- Address a Problem with a Specific Datastore
- Identify the Host and Datastore with the Highest Latency
- Optimizing Data for Capacity
- Determine How Efficiently You Use the Virtual Infrastructure
- Identify the Consolidation Ratio Trend for a Datacenter or Cluster
- Determine Reclaimable Resources from Underused Objects
- Assess Virtual Machine Capacity Use
- Assess Virtual Machine Optimization Data
- Identify Powered-Off Virtual Machines to Optimize Data
- Identify Idle Virtual Machines to Optimize Capacity
- Identify Oversized Virtual Machines to Optimize Data
- Determine the Trend of Waste for a Virtual Machine
- Forecasting Data for Capacity Risk
- Create Capacity Scenarios for Virtual Machines With New Profiles
- Create Capacity Scenarios for Virtual Machines With Existing Profiles
- Create a Hardware Change Scenario
- Create a What-If Scenario to Remove Virtual Machines
- Combine the Results of What-If Scenarios
- Compare the Results of What-If Scenarios
- Delete a Scenario from the What-If Scenarios List
- Analyzing Data for Capacity Risk
- Working with Faults and Alerts
- Working with Groups
- Set How Data Appears in vCenter Operations Manager
- Create a New Policy
- Set the General Parameters of a Policy
- Associate a Policy with One or More Groups
- Customize Badge Thresholds for Infrastructure Objects
- Customize Badge Thresholds for Virtual Machine Objects
- Customize the Badge Thresholds for Groups
- Modify Capacity and Time Remaining Settings
- Modify Usable Capacity Settings
- Modify Usage Calculation Settings
- Modify the Criteria for Powered-Off and Idle Virtual Machine State
- Modify the Criteria for Oversized and Undersized Virtual Machines
- Modify the Criteria for Underused and Stressed Capacity
- Select Which Badges Generate Alerts
- Modify Trend and Forecast Analysis Settings
- Modify an Existing Policy
- Modify Summary, Views, and Reports Settings
- Create a New Policy
- Monitor the Performance of vCenter Operations Manager
- Index

Using the Density Badge Under the Efficiency Badge
The vCenter Operations Manager Density badge measures consolidation ratios to assess cost savings. You
can assess the behavior and performance of a virtual machine and related applications to maximize the
consolidation ratio without affecting the performance or service level agreements.
The density score is the ratio of the actual density to an ideal density based on the demand, the amount of
virtual capacity, and the amount of physical usable capacity. Density calculates the amount of resources that
you can provision before contention or conflict for a resource occurs between objects. The ratios account for
the number of virtual machines to host, the number of virtual CPUs to physical CPU, and the amount of
virtual memory to physical memory.
The Density score ranges between 0 (bad) and 100 (good). The badge changes its color based on the badge
score thresholds that are set by the vCenter Operations Manager administrator.
Table 2‑13. Object Density States
Badge Icon Description User Action
The resource consolidation is
good.
No attention required.
Some resources are not fully
consolidated.
Select Planning > Views to
identify resource consolidation
opportunities.
The consolidation for many
resources is low.
Select Planning > Views to
identify resource consolidation
opportunities.
The resource consolidation is
extremely low.
Select Planning > Views to
identify resource consolidation
opportunities.
No data is available for any of
the metrics for the time period.
The object is offline.
A vCenter Operations Manager administrator can change the badge score thresholds. For example, a green
Density badge can indicate a score above 40 instead of 25, as set by default.
Working with Metrics and Charts on the All Metrics Tab
You can check the location of an object in the hierarchy and select metrics to view graphs of their historic
values for a period you define.
You can use the panes on the All Metrics tab under the Operations tab to search metrics and view metric
graphs.
The Health Tree Pane
The Health Tree pane displays the location of the currently selected object in the hierarchy of your virtual
infrastructure. You can check all parent and child objects related to the currently selected object.
For example, the sample hierarchy shows the parent and child objects in the virtual infrastructure. The red
icon indicates a presence of a potential problem in the vCenter Server object. You can investigate the
probable cause of the problem from the Dashboard tab.
VMware vCenter Operations Manager Getting Started Guide
22 VMware, Inc.