
5.8.5
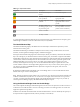
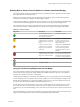
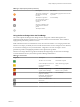
Table Of Contents
- VMware vCenter Operations Manager Getting Started Guide
- Contents
- VMware vCenter Operations Manager Getting Started Guide
- Introducing Key Features and Concepts
- Beginning to Monitor the Virtual Environment
- Object Type Icons in the Inventory Pane
- Badge Concepts for vCenter Operations Manager
- Major Badges in vCenter Operations Manager
- Working with Metrics and Charts on the All Metrics Tab
- Viewing Members and Relationships in the Monitored Environment
- Check the Performance of Your Virtual Environment
- Balancing the Resources in Your Virtual Environment
- Find an ESX Host that Has Resources for More Virtual Machines
- Find a Cluster that Has Resources Available for More Virtual Machines
- Ranking the Health, Risk, and Efficiency Scores
- View the Compliance Details
- View a List of Members
- Overview of Relationships
- Troubleshooting with vCenter Operations Manager
- Troubleshooting Overview
- Troubleshooting a Help Desk Problem
- Troubleshooting an Alert
- Finding Problems in the Virtual Environment
- Finding the Cause of the Problem
- Determine Whether the Environment Operates as Expected
- Identify the Source of Performance Degradation
- Identify the Underlying Memory Resource Problem for a Virtual Machine
- Identify the Underlying Memory Resource Problem for Clusters and Hosts
- Identify the Top Resource Consumers
- Identify Events that Occurred when an Object Experienced Performance Degradation
- Determine the Extent of a Performance Degradation
- Determine the Timeframe and Nature of a Health Issue
- Determine the Cause of a Problem with a Specific Object
- Fix the Cause of the Problem
- Assessing Risk and Efficiency in vCenter Operations Manager
- Analyzing Data for Capacity Risk
- Determine When an Object Might Run Out of Resources
- Identify Clusters with the Space for Virtual Machines
- Investigating Abnormal Host Health
- Identify Datastores with Space for Virtual Machines
- Identify Datastores with Wasted Space
- Address a Problem with a Specific Virtual Machine
- Identify the Virtual Machines with Resource Waste Across Datastores
- Address a Problem with a Specific Datastore
- Identify the Host and Datastore with the Highest Latency
- Optimizing Data for Capacity
- Determine How Efficiently You Use the Virtual Infrastructure
- Identify the Consolidation Ratio Trend for a Datacenter or Cluster
- Determine Reclaimable Resources from Underused Objects
- Assess Virtual Machine Capacity Use
- Assess Virtual Machine Optimization Data
- Identify Powered-Off Virtual Machines to Optimize Data
- Identify Idle Virtual Machines to Optimize Capacity
- Identify Oversized Virtual Machines to Optimize Data
- Determine the Trend of Waste for a Virtual Machine
- Forecasting Data for Capacity Risk
- Create Capacity Scenarios for Virtual Machines With New Profiles
- Create Capacity Scenarios for Virtual Machines With Existing Profiles
- Create a Hardware Change Scenario
- Create a What-If Scenario to Remove Virtual Machines
- Combine the Results of What-If Scenarios
- Compare the Results of What-If Scenarios
- Delete a Scenario from the What-If Scenarios List
- Analyzing Data for Capacity Risk
- Working with Faults and Alerts
- Working with Groups
- Set How Data Appears in vCenter Operations Manager
- Create a New Policy
- Set the General Parameters of a Policy
- Associate a Policy with One or More Groups
- Customize Badge Thresholds for Infrastructure Objects
- Customize Badge Thresholds for Virtual Machine Objects
- Customize the Badge Thresholds for Groups
- Modify Capacity and Time Remaining Settings
- Modify Usable Capacity Settings
- Modify Usage Calculation Settings
- Modify the Criteria for Powered-Off and Idle Virtual Machine State
- Modify the Criteria for Oversized and Undersized Virtual Machines
- Modify the Criteria for Underused and Stressed Capacity
- Select Which Badges Generate Alerts
- Modify Trend and Forecast Analysis Settings
- Modify an Existing Policy
- Modify Summary, Views, and Reports Settings
- Create a New Policy
- Monitor the Performance of vCenter Operations Manager
- Index

Defining Risk to Assess Future Problems in vCenter Operations Manager
The vCenter Operations Manager Risk badge indicates a potential performance problem in the near future
that might affect the virtual environment.
Risk involves the time remaining, capacity remaining, and stress factors that account for the time buffer,
remaining virtual machines, and degree of habitual high workload.
vCenter Operations Manager calculates the risk score using the scores of the sub-badges that the Risk badge
contains. The formula that is applied to calculate the risk score is inverse geometric weighted mean.
The overall risk score for an object ranges between 0 (no risk) to 100 (serious risk). The badge changes its
color based on the badge score thresholds that are set by the vCenter Operations Manager administrator.
Table 2‑6. Object Risk States
Badge Icon Description User Action
The selected object has no
current problems. No problems
are expected in the future.
No attention required.
A low chance of future
problems exists or a potential
problem might occur in the far
future.
Navigate to the Scoreboard tab
to check which resources are
likely to exhaust and plan for
appropriate actions.
A chance of a more serious
problem exists or a problem
might occur in the medium-
term future.
Navigate to the Scoreboard tab
to check which resources are
close to exhausting and take
appropriate actions as soon as
possible.
The chances of a serious future
problem are high or a problem
might occur in the near future.
Navigate to the Scoreboard tab
in to check which resources are
exhausted and act immediately
to resolve or prevent problems.
No data is available.
The object is offline.
Using the Time Remaining Badge Under the Risk Badge
The vCenter Operations Manager Time Remaining badge measures the time before a resource associated
with an object reaches capacity. This badge indicates the available timeframe to provision or load balance
the physical or virtual resources for a selected object.
vCenter Operations Manager calculates the Time Remaining score as a percentage of time that is remaining
for each compute resource compared to the provisioning buffer you set in the Configuration dialog box. By
default, the Time Remaining score provisioning buffer is 30 days. If even one of the compute resources has
less capacity than the provisioned buffer, the Time Remaining score is 0.
For example, if the provisioning buffer is set to 30 days, and the object that you selected has CPU resources
for 81 days, memory resources for 5 days, disk I/O resources for 200 days, and network I/O resources for
more than one year, the Time Remaining score is 0, because one of the resources has capacity for less than 30
days.
The Time Remaining score ranges between 0 (bad) and 100 (good). The badge changes its color based on the
badge score thresholds that are set by the vCenter Operations Manager administrator.
Chapter 2 Beginning to Monitor the Virtual Environment
VMware, Inc. 17