
5.8.5
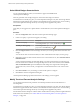
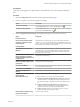
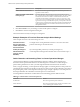
Table Of Contents
- VMware vCenter Operations Manager Getting Started Guide
- Contents
- VMware vCenter Operations Manager Getting Started Guide
- Introducing Key Features and Concepts
- Beginning to Monitor the Virtual Environment
- Object Type Icons in the Inventory Pane
- Badge Concepts for vCenter Operations Manager
- Major Badges in vCenter Operations Manager
- Working with Metrics and Charts on the All Metrics Tab
- Viewing Members and Relationships in the Monitored Environment
- Check the Performance of Your Virtual Environment
- Balancing the Resources in Your Virtual Environment
- Find an ESX Host that Has Resources for More Virtual Machines
- Find a Cluster that Has Resources Available for More Virtual Machines
- Ranking the Health, Risk, and Efficiency Scores
- View the Compliance Details
- View a List of Members
- Overview of Relationships
- Troubleshooting with vCenter Operations Manager
- Troubleshooting Overview
- Troubleshooting a Help Desk Problem
- Troubleshooting an Alert
- Finding Problems in the Virtual Environment
- Finding the Cause of the Problem
- Determine Whether the Environment Operates as Expected
- Identify the Source of Performance Degradation
- Identify the Underlying Memory Resource Problem for a Virtual Machine
- Identify the Underlying Memory Resource Problem for Clusters and Hosts
- Identify the Top Resource Consumers
- Identify Events that Occurred when an Object Experienced Performance Degradation
- Determine the Extent of a Performance Degradation
- Determine the Timeframe and Nature of a Health Issue
- Determine the Cause of a Problem with a Specific Object
- Fix the Cause of the Problem
- Assessing Risk and Efficiency in vCenter Operations Manager
- Analyzing Data for Capacity Risk
- Determine When an Object Might Run Out of Resources
- Identify Clusters with the Space for Virtual Machines
- Investigating Abnormal Host Health
- Identify Datastores with Space for Virtual Machines
- Identify Datastores with Wasted Space
- Address a Problem with a Specific Virtual Machine
- Identify the Virtual Machines with Resource Waste Across Datastores
- Address a Problem with a Specific Datastore
- Identify the Host and Datastore with the Highest Latency
- Optimizing Data for Capacity
- Determine How Efficiently You Use the Virtual Infrastructure
- Identify the Consolidation Ratio Trend for a Datacenter or Cluster
- Determine Reclaimable Resources from Underused Objects
- Assess Virtual Machine Capacity Use
- Assess Virtual Machine Optimization Data
- Identify Powered-Off Virtual Machines to Optimize Data
- Identify Idle Virtual Machines to Optimize Capacity
- Identify Oversized Virtual Machines to Optimize Data
- Determine the Trend of Waste for a Virtual Machine
- Forecasting Data for Capacity Risk
- Create Capacity Scenarios for Virtual Machines With New Profiles
- Create Capacity Scenarios for Virtual Machines With Existing Profiles
- Create a Hardware Change Scenario
- Create a What-If Scenario to Remove Virtual Machines
- Combine the Results of What-If Scenarios
- Compare the Results of What-If Scenarios
- Delete a Scenario from the What-If Scenarios List
- Analyzing Data for Capacity Risk
- Working with Faults and Alerts
- Working with Groups
- Set How Data Appears in vCenter Operations Manager
- Create a New Policy
- Set the General Parameters of a Policy
- Associate a Policy with One or More Groups
- Customize Badge Thresholds for Infrastructure Objects
- Customize Badge Thresholds for Virtual Machine Objects
- Customize the Badge Thresholds for Groups
- Modify Capacity and Time Remaining Settings
- Modify Usable Capacity Settings
- Modify Usage Calculation Settings
- Modify the Criteria for Powered-Off and Idle Virtual Machine State
- Modify the Criteria for Oversized and Undersized Virtual Machines
- Modify the Criteria for Underused and Stressed Capacity
- Select Which Badges Generate Alerts
- Modify Trend and Forecast Analysis Settings
- Modify an Existing Policy
- Modify Summary, Views, and Reports Settings
- Create a New Policy
- Monitor the Performance of vCenter Operations Manager
- Index

Prerequisites
Verify that you are logged in to a vSphere Client as an administrator, and vCenter Operations Manager is
open.
Procedure
1 Click the Configuration link on the main vCenter Operations Manager page.
2 Create a new policy or open an existing policy for editing.
Option Description
To create a new policy
In the Manage Policies pane, click the Create Policy icon .
To modify an existing policy
In the Manage Policies pane, select the policy that you want to associate to
groups and click the Edit Policy icon .
3 Click 6 Configure forecast and trends, and change the settings for trend and forecast analysis.
Option Description
Forecast Functions
Do not forecast answers beyond
percentage % of the time range
used for analysis
Determines how far into the future to forecast data. If this setting is too
limited, it can cause Time Remaining data in the dashboard to appear as a
dash (-). This occurs because vCenter Operations Manager cannot calculate
the remaining values within the forecast period.
Forecast Method
Select Best Fit from all Forecast
Methods
Instructs vCenter Operations Manager to determine the function with the
least potential error. vCenter Operations Manager applies all functions
before determining the function with the best fit. The best fit function is
based only on the current data.
Eliminate functions that have more
than percentage % of curvature
change beyond fitted data and prior
to forecast limit
Discards functions that cause the trend to increase or decrease at a faster
rate than the specified setting.
Eliminate non-linear functions for
data sets less than number of data
points points
Specifies that the best fit function use the linear function when the number
of data points is less than this setting.
Force Forecast Method
Forces the forecast function for trend analysis. The linear method provides
a true representation of the range.
Trend and Forecast Data Filter
Trend collected data with no
filtering
Prevents the use of outlier detection or smoothing.
Apply one or more smoothing filters
prior to trending
Activates outlier detection and smoothing options.
Smooth data prior to fit
Activates smoothing. You can select the smoothing method.
n
EWMA (Exponentially Weighted Moving Average) calculates each
smooth data point as a weighted mean of the preceding data points
such that more weight or importance is given to data points closer to
it.
n
GWMA (Geometrically Weighted Moving Average) applies a
weighted geometric mean instead of a weighted arithmetic mean.
GWMA is more stable amidst fluctuations than EWMA.
n
Lifetime Average calculates each smooth data point as a simple
arithmetic mean of the preceding data points.
Detect outliers and plateaus using
progressive fit analysis
Activates outlier detection.
Chapter 8 Set How Data Appears in vCenter Operations Manager
VMware, Inc. 107