
5.8.5
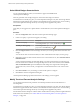
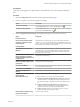
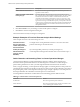
Table Of Contents
- VMware vCenter Operations Manager Getting Started Guide
- Contents
- VMware vCenter Operations Manager Getting Started Guide
- Introducing Key Features and Concepts
- Beginning to Monitor the Virtual Environment
- Object Type Icons in the Inventory Pane
- Badge Concepts for vCenter Operations Manager
- Major Badges in vCenter Operations Manager
- Working with Metrics and Charts on the All Metrics Tab
- Viewing Members and Relationships in the Monitored Environment
- Check the Performance of Your Virtual Environment
- Balancing the Resources in Your Virtual Environment
- Find an ESX Host that Has Resources for More Virtual Machines
- Find a Cluster that Has Resources Available for More Virtual Machines
- Ranking the Health, Risk, and Efficiency Scores
- View the Compliance Details
- View a List of Members
- Overview of Relationships
- Troubleshooting with vCenter Operations Manager
- Troubleshooting Overview
- Troubleshooting a Help Desk Problem
- Troubleshooting an Alert
- Finding Problems in the Virtual Environment
- Finding the Cause of the Problem
- Determine Whether the Environment Operates as Expected
- Identify the Source of Performance Degradation
- Identify the Underlying Memory Resource Problem for a Virtual Machine
- Identify the Underlying Memory Resource Problem for Clusters and Hosts
- Identify the Top Resource Consumers
- Identify Events that Occurred when an Object Experienced Performance Degradation
- Determine the Extent of a Performance Degradation
- Determine the Timeframe and Nature of a Health Issue
- Determine the Cause of a Problem with a Specific Object
- Fix the Cause of the Problem
- Assessing Risk and Efficiency in vCenter Operations Manager
- Analyzing Data for Capacity Risk
- Determine When an Object Might Run Out of Resources
- Identify Clusters with the Space for Virtual Machines
- Investigating Abnormal Host Health
- Identify Datastores with Space for Virtual Machines
- Identify Datastores with Wasted Space
- Address a Problem with a Specific Virtual Machine
- Identify the Virtual Machines with Resource Waste Across Datastores
- Address a Problem with a Specific Datastore
- Identify the Host and Datastore with the Highest Latency
- Optimizing Data for Capacity
- Determine How Efficiently You Use the Virtual Infrastructure
- Identify the Consolidation Ratio Trend for a Datacenter or Cluster
- Determine Reclaimable Resources from Underused Objects
- Assess Virtual Machine Capacity Use
- Assess Virtual Machine Optimization Data
- Identify Powered-Off Virtual Machines to Optimize Data
- Identify Idle Virtual Machines to Optimize Capacity
- Identify Oversized Virtual Machines to Optimize Data
- Determine the Trend of Waste for a Virtual Machine
- Forecasting Data for Capacity Risk
- Create Capacity Scenarios for Virtual Machines With New Profiles
- Create Capacity Scenarios for Virtual Machines With Existing Profiles
- Create a Hardware Change Scenario
- Create a What-If Scenario to Remove Virtual Machines
- Combine the Results of What-If Scenarios
- Compare the Results of What-If Scenarios
- Delete a Scenario from the What-If Scenarios List
- Analyzing Data for Capacity Risk
- Working with Faults and Alerts
- Working with Groups
- Set How Data Appears in vCenter Operations Manager
- Create a New Policy
- Set the General Parameters of a Policy
- Associate a Policy with One or More Groups
- Customize Badge Thresholds for Infrastructure Objects
- Customize Badge Thresholds for Virtual Machine Objects
- Customize the Badge Thresholds for Groups
- Modify Capacity and Time Remaining Settings
- Modify Usable Capacity Settings
- Modify Usage Calculation Settings
- Modify the Criteria for Powered-Off and Idle Virtual Machine State
- Modify the Criteria for Oversized and Undersized Virtual Machines
- Modify the Criteria for Underused and Stressed Capacity
- Select Which Badges Generate Alerts
- Modify Trend and Forecast Analysis Settings
- Modify an Existing Policy
- Modify Summary, Views, and Reports Settings
- Create a New Policy
- Monitor the Performance of vCenter Operations Manager
- Index

Option Description
Entire range
Sets the time range to analyze as the range defined in the Manage Display
Settings section of the Configuration dialog box.
Consider allocation in stress
calculation
Enables an allocation model in calculating stress. Allocation considers
allocated resources as used, and unallocated resources as capacity
remaining.
4 Click OK or Finish to save your settings, or select another option to configure.
5 Click Done to close the Configuration dialog box.
The criteria for underused and stressed capacity are reconfigured.
Determining the Underused and Stressed Capacity Thresholds
You determine the thresholds for underused and stressed capacity on ESX hosts and clusters to define what
is acceptable in your virtual environment.
You can set the underused and stressed capacity thresholds in the 4 Configure state-related thresholds
section of the Edit Policy dialog box.
You determine the time period for which values are computed by using the Usage Work Week setting in the
3c Usage calculation section. By default, vCenter Operations Manager uses a 24-hour period, 7 days a week,
but you can modify this setting. The following examples use the default usage calculation setting.
Underused and stressed capacity thresholds represent the degree to which you allow the resources to be
underused or stressed. Underused and stressed capacity thresholds are computed as an area ratio between
the demand area in the stressed zone and the area of the stressed zone.
Example: Calculating the Thresholds for a Stressed or Underused Resources
To set the thresholds for a one-week interval, open the Configuration dialog box and click Manage Display
Settings. Set the Non-Trend Views Interval to Weekly and select 1 as the number of intervals to use.
You set the percentage of affordable stress or underuse in the 4c Underused and stressed section of the Edit
Policy dialog box. Determine the area ratio for which you can afford to have high stress or low use in your
environment.
To determine the stress threshold for a day, multiply the stress area ratio by 100.
Demand in the stress zone/stressed zone * 100
For stress, even an hour or two per week might represent a problem, because during that time the capacity
is almost exhausted. Therefore, you can set a peak time period as well as the stress threshold, and specify
the maximum number of hours that can have stress levels above the specified threshold.
By setting this peak period, you define a "moving window" of a number of hours, and the stress calculation
will be applied to every such window in the Non-Trend Views Interval. The stress calculation is:
stressed % = max_(for each moving window)(demand area in the stress zone in the window/area of
stressed zone in the window)
Example: Calculating the Thresholds for Underused and Stressed Resources for Four Weekly
Intervals
To set the thresholds for four weekly intervals, open the Configuration dialog box and click Manage
Display Settings. Set the Non-Trend Views Interval to Weekly and select 4 as the number of intervals to
use.
Example: Limiting the Thresholds for Business Days and Hours
To restrict the stress limit to 8 business hours, Monday to Friday, specify the hours and days in the 3c Usage
calculation section of the policy configuration dialog box.
Chapter 8 Set How Data Appears in vCenter Operations Manager
VMware, Inc. 105