
5.8.5
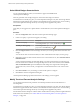
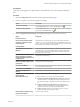
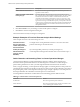
Table Of Contents
- VMware vCenter Operations Manager Getting Started Guide
- Contents
- VMware vCenter Operations Manager Getting Started Guide
- Introducing Key Features and Concepts
- Beginning to Monitor the Virtual Environment
- Object Type Icons in the Inventory Pane
- Badge Concepts for vCenter Operations Manager
- Major Badges in vCenter Operations Manager
- Working with Metrics and Charts on the All Metrics Tab
- Viewing Members and Relationships in the Monitored Environment
- Check the Performance of Your Virtual Environment
- Balancing the Resources in Your Virtual Environment
- Find an ESX Host that Has Resources for More Virtual Machines
- Find a Cluster that Has Resources Available for More Virtual Machines
- Ranking the Health, Risk, and Efficiency Scores
- View the Compliance Details
- View a List of Members
- Overview of Relationships
- Troubleshooting with vCenter Operations Manager
- Troubleshooting Overview
- Troubleshooting a Help Desk Problem
- Troubleshooting an Alert
- Finding Problems in the Virtual Environment
- Finding the Cause of the Problem
- Determine Whether the Environment Operates as Expected
- Identify the Source of Performance Degradation
- Identify the Underlying Memory Resource Problem for a Virtual Machine
- Identify the Underlying Memory Resource Problem for Clusters and Hosts
- Identify the Top Resource Consumers
- Identify Events that Occurred when an Object Experienced Performance Degradation
- Determine the Extent of a Performance Degradation
- Determine the Timeframe and Nature of a Health Issue
- Determine the Cause of a Problem with a Specific Object
- Fix the Cause of the Problem
- Assessing Risk and Efficiency in vCenter Operations Manager
- Analyzing Data for Capacity Risk
- Determine When an Object Might Run Out of Resources
- Identify Clusters with the Space for Virtual Machines
- Investigating Abnormal Host Health
- Identify Datastores with Space for Virtual Machines
- Identify Datastores with Wasted Space
- Address a Problem with a Specific Virtual Machine
- Identify the Virtual Machines with Resource Waste Across Datastores
- Address a Problem with a Specific Datastore
- Identify the Host and Datastore with the Highest Latency
- Optimizing Data for Capacity
- Determine How Efficiently You Use the Virtual Infrastructure
- Identify the Consolidation Ratio Trend for a Datacenter or Cluster
- Determine Reclaimable Resources from Underused Objects
- Assess Virtual Machine Capacity Use
- Assess Virtual Machine Optimization Data
- Identify Powered-Off Virtual Machines to Optimize Data
- Identify Idle Virtual Machines to Optimize Capacity
- Identify Oversized Virtual Machines to Optimize Data
- Determine the Trend of Waste for a Virtual Machine
- Forecasting Data for Capacity Risk
- Create Capacity Scenarios for Virtual Machines With New Profiles
- Create Capacity Scenarios for Virtual Machines With Existing Profiles
- Create a Hardware Change Scenario
- Create a What-If Scenario to Remove Virtual Machines
- Combine the Results of What-If Scenarios
- Compare the Results of What-If Scenarios
- Delete a Scenario from the What-If Scenarios List
- Analyzing Data for Capacity Risk
- Working with Faults and Alerts
- Working with Groups
- Set How Data Appears in vCenter Operations Manager
- Create a New Policy
- Set the General Parameters of a Policy
- Associate a Policy with One or More Groups
- Customize Badge Thresholds for Infrastructure Objects
- Customize Badge Thresholds for Virtual Machine Objects
- Customize the Badge Thresholds for Groups
- Modify Capacity and Time Remaining Settings
- Modify Usable Capacity Settings
- Modify Usage Calculation Settings
- Modify the Criteria for Powered-Off and Idle Virtual Machine State
- Modify the Criteria for Oversized and Undersized Virtual Machines
- Modify the Criteria for Underused and Stressed Capacity
- Select Which Badges Generate Alerts
- Modify Trend and Forecast Analysis Settings
- Modify an Existing Policy
- Modify Summary, Views, and Reports Settings
- Create a New Policy
- Monitor the Performance of vCenter Operations Manager
- Index

2 Create a new policy or open an existing policy for editing.
Option Description
To create a new policy
In the Manage Policies pane, click the Create Policy icon .
To modify an existing policy
In the Manage Policies pane, select the policy that you want to associate to
groups and click the Edit Policy icon .
3 Click 4c Underuse and stress and change the settings for underused and stressed rules.
Containers include World, vCenters, data centers, clusters, and hosts, but not groups or datastores.
Option Description
Containers are underused when:
Amount of CPU demand below
Considers the container underused when either of the following conditions
are met:
n
CPU use is less than the percentage of its allocated capacity as
indicated in this field.
n
Duration of CPU activity under the threshold compared to total time
evaluated meets the percentage Underused threshold.
Amount of memory demand below
Considers the container underused when either of the following conditions
are met:
n
Memory use is less than the percentage of its allocated capacity as
indicated in this field.
n
Duration of memory activity under the threshold compared to total
time evaluated meets the percentage Underused threshold.
is more than number% for the entire
range
Sets the amount of nonusage in the entire environment defined by the %
underuse thresholds, calculated for the time interval over which the
nonusage is analyzed.
You define the time range in the Manage Display Settings section of the
Configuration dialog box.
Datastores:
Snapshots and templates are
considered waste after numberdays
Determines the number of days since creation when a snapshot or a
template becomes a waste resource. For example, if the waste bin is set to
90 days and a snapshot is 88 days old, the snapshot is not considered as
waste. Only snapshots or templates that are older than 90 days are
considered as waste.
Containers have stress when:
Amount of CPU demand above
Considers the host or cluster stressed when either of the following
conditions are met:
n
CPU use is more than the percentage of its allocated capacity as
indicated in this field.
n
Duration of CPU activity under the threshold compared to total time
evaluated meets the % stressed threshold.
Amount of memory demand above
Considers the host or cluster stressed when either of the following
conditions are met:
n
Memory use is more than the percentage of its allocated capacity as
indicated in this field.
n
Duration of memory activity under the threshold compared to total
time evaluated meets the % stressed threshold.
is more than number% for
Sets the amount of use in the entire environment defined by the % stressed
threshold and the time range to analyze.
Any number hour period
Sets the time range to analyze as a period of hours.
VMware vCenter Operations Manager Getting Started Guide
104 VMware, Inc.