
5.7
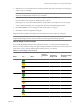
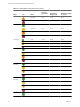
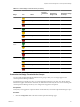
Table Of Contents
- VMware vCenter Operations Manager Getting Started Guide
- Contents
- VMware vCenter Operations Manager Getting Started Guide
- Introducing Key Features and Concepts
- Beginning to Monitor the Virtual Environment
- Object Type Icons in the Inventory Pane
- Badge Concepts for vCenter Operations Manager
- Major Badges in vCenter Operations Manager
- Working with Metrics and Charts on the All Metrics Tab
- Viewing Members and Relationships in the Monitored Environment
- Check the Performance of Your Virtual Environment
- Balancing the Resources in Your Virtual Environment
- Find an ESX Host that Has Resources for More Virtual Machines
- Find a Cluster that Has Resources Available for More Virtual Machines
- Ranking the Health, Risk, and Efficiency Scores
- View the Compliance Details
- View a List of Members
- Overview of Relationships
- Troubleshooting with vCenter Operations Manager
- Troubleshooting Overview
- Troubleshooting a Help Desk Problem
- Troubleshooting an Alert
- Finding Problems in the Virtual Environment
- Finding the Cause of the Problem
- Determine Whether the Environment Operates as Expected
- Identify the Source of Performance Degradation
- Identify the Underlying Memory Resource Problem for a Virtual Machine
- Identify the Underlying Memory Resource Problem for Clusters and Hosts
- Identify the Top Resource Consumers
- Identify Events that Occurred when an Object Experienced Performance Degradation
- Determine the Extent of a Performance Degradation
- Determine the Timeframe and Nature of a Health Issue
- Determine the Cause of a Problem with a Specific Object
- Fix the Cause of the Problem
- Assessing Risk and Efficiency in vCenter Operations Manager
- Analyzing Data for Capacity Risk
- Determine When an Object Might Run Out of Resources
- Identify Clusters with the Space for Virtual Machines
- Investigating Abnormal Host Health
- Identify Datastores with Space for Virtual Machines
- Identify Datastores with Wasted Space
- Address a Problem with a Specific Virtual Machine
- Identify the Virtual Machines with Resource Waste Across Datastores
- Address a Problem with a Specific Datastore
- Identify the Host and Datastore with the Highest Latency
- Optimizing Data for Capacity
- Determine How Efficiently You Use the Virtual Infrastructure
- Identify the Consolidation Ratio Trend for a Datacenter or Cluster
- Determine Reclaimable Resources from Underused Objects
- Assess Virtual Machine Capacity Use
- Assess Virtual Machine Optimization Data
- Identify Powered-Off Virtual Machines to Optimize Data
- Identify Idle Virtual Machines to Optimize Capacity
- Identify Oversized Virtual Machines to Optimize Data
- Determine the Trend of Waste for a Virtual Machine
- Forecasting Data for Capacity Risk
- Create Capacity Scenarios for Virtual Machines With New Profiles
- Create Capacity Scenarios for Virtual Machines With Existing Profiles
- Create a Hardware Change Scenario
- Create a What-If Scenario to Remove Virtual Machines
- Combine the Results of What-If Scenarios
- Compare the Results of What-If Scenarios
- Delete a Scenario from the What-If Scenarios List
- Analyzing Data for Capacity Risk
- Working with Faults and Alerts
- Working with Groups
- Set How Data Appears in vCenter Operations Manager
- Create a New Policy
- Set the General Parameters of a Policy
- Associate a Policy with One or More Groups
- Customize Badge Thresholds for Infrastructure Objects
- Customize Badge Thresholds for Virtual Machine Objects
- Customize the Badge Thresholds for Groups
- Modify Capacity and Time Remaining Settings
- Modify Usable Capacity Settings
- Modify Usage Calculation Settings
- Modify the Criteria for Powered-Off and Idle Virtual Machine State
- Modify the Criteria for Oversized and Undersized Virtual Machines
- Modify the Criteria for Underused and Stressed Capacity
- Select Which Badges Generate Alerts
- Modify Trend and Forecast Analysis Settings
- Modify an Existing Policy
- Modify Summary, Views, and Reports Settings
- Create a New Policy
- Monitor the Performance of vCenter Operations Manager
- Index

3 Click 3a Capacity and time remaining and modify the settings.
Option Description
Spikes and Peaks
Determines whether to take the more conservative approach of using stress
in accounting for spikes and peaks in capacity use.
Capacity Remaining is based on:
Choose the model for capacity calculations:
n
Physical or Configured Capacity. Uses physical capacity in metric
calculations. vCenter Operations Manager does not calculate VMware
HA and buffer percentages.
n
Usable Capacity. Activates support for VMware HA and buffer
percentages in metric calculations. You can further specify HA and
buffer settings in the Usable Capacity global settings.
Time Remaining is based on:
Contains settings that affect the calculations of Time Remaining badge scores
and alerts.
n
From the drop-down menu, select the algorithm to be used for
calculating the Time Remaining badge score.
n
Select Planning Cyclical to use planning data and algorithm.
n
Select Real Time to use real time data and algorithm.
n
In the Days of provisioning buffer text box, type the number of days to
be used as score provisioning buffer when calculating the score of the
Time Remaining badge. vCenter Operations Managerapplies the
following formula to calculate the badge score.
Time Remaining badge score = Log10(Time Remaining -
Provisioning Buffer
Threshold + 1) / Log10(Time Remaining Window -
Provisioning Buffer Threshold + 1) * 100
Demand or Allocation by Compute
Resource
For each compute resource (VM, Datastore, or Containers), select whether to
use Demand or Allocation (or both) in calculations for CPU, Memory, Disk
I/O, Disk Space, and Network I/0. Containers are the World, vCenters, data
centers, clusters and hosts, but not groups.
A Demand model uses requested resources to calculate remaining resources.
An Allocation model considers allocated resources to be used and
unallocated resources as capacity remaining. Demand is more aggressive,
while Allocation is more conservative.
Reservations for CPU and Memory are always included in Capacity and
Time remaining calculations.
4 Click OK or Finish to save your settings, or select another option to configure.
5 Click Done to close the Configuration dialog box.
The capacity and time remaining settings are reconfigured.
Example: Examples of Capacity and Time Remaining Settings
These examples show how some of the settings are used.
Compute Resources to
Analyze
If you have a mixed host environment or your ESX or vSphere version limits
the ability to view disk I/O metrics, you can turn off that resource type.
Usable Capacity
If you stress the load on your systems and want extra headroom for error,
activate buffer support with this setting.
What to do next
If you selected Usable Capacity, configure the high availability and buffer settings in section 3b Usable
capacity of the policy configuration dialog box.
Chapter 8 Set How Data Appears in vCenter Operations Manager
VMware, Inc. 95