
5.7

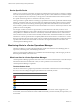

Table Of Contents
- VMware vCenter Operations Manager Getting Started Guide
- Contents
- VMware vCenter Operations Manager Getting Started Guide
- Introducing Key Features and Concepts
- Beginning to Monitor the Virtual Environment
- Object Type Icons in the Inventory Pane
- Badge Concepts for vCenter Operations Manager
- Major Badges in vCenter Operations Manager
- Working with Metrics and Charts on the All Metrics Tab
- Viewing Members and Relationships in the Monitored Environment
- Check the Performance of Your Virtual Environment
- Balancing the Resources in Your Virtual Environment
- Find an ESX Host that Has Resources for More Virtual Machines
- Find a Cluster that Has Resources Available for More Virtual Machines
- Ranking the Health, Risk, and Efficiency Scores
- View the Compliance Details
- View a List of Members
- Overview of Relationships
- Troubleshooting with vCenter Operations Manager
- Troubleshooting Overview
- Troubleshooting a Help Desk Problem
- Troubleshooting an Alert
- Finding Problems in the Virtual Environment
- Finding the Cause of the Problem
- Determine Whether the Environment Operates as Expected
- Identify the Source of Performance Degradation
- Identify the Underlying Memory Resource Problem for a Virtual Machine
- Identify the Underlying Memory Resource Problem for Clusters and Hosts
- Identify the Top Resource Consumers
- Identify Events that Occurred when an Object Experienced Performance Degradation
- Determine the Extent of a Performance Degradation
- Determine the Timeframe and Nature of a Health Issue
- Determine the Cause of a Problem with a Specific Object
- Fix the Cause of the Problem
- Assessing Risk and Efficiency in vCenter Operations Manager
- Analyzing Data for Capacity Risk
- Determine When an Object Might Run Out of Resources
- Identify Clusters with the Space for Virtual Machines
- Investigating Abnormal Host Health
- Identify Datastores with Space for Virtual Machines
- Identify Datastores with Wasted Space
- Address a Problem with a Specific Virtual Machine
- Identify the Virtual Machines with Resource Waste Across Datastores
- Address a Problem with a Specific Datastore
- Identify the Host and Datastore with the Highest Latency
- Optimizing Data for Capacity
- Determine How Efficiently You Use the Virtual Infrastructure
- Identify the Consolidation Ratio Trend for a Datacenter or Cluster
- Determine Reclaimable Resources from Underused Objects
- Assess Virtual Machine Capacity Use
- Assess Virtual Machine Optimization Data
- Identify Powered-Off Virtual Machines to Optimize Data
- Identify Idle Virtual Machines to Optimize Capacity
- Identify Oversized Virtual Machines to Optimize Data
- Determine the Trend of Waste for a Virtual Machine
- Forecasting Data for Capacity Risk
- Create Capacity Scenarios for Virtual Machines With New Profiles
- Create Capacity Scenarios for Virtual Machines With Existing Profiles
- Create a Hardware Change Scenario
- Create a What-If Scenario to Remove Virtual Machines
- Combine the Results of What-If Scenarios
- Compare the Results of What-If Scenarios
- Delete a Scenario from the What-If Scenarios List
- Analyzing Data for Capacity Risk
- Working with Faults and Alerts
- Working with Groups
- Set How Data Appears in vCenter Operations Manager
- Create a New Policy
- Set the General Parameters of a Policy
- Associate a Policy with One or More Groups
- Customize Badge Thresholds for Infrastructure Objects
- Customize Badge Thresholds for Virtual Machine Objects
- Customize the Badge Thresholds for Groups
- Modify Capacity and Time Remaining Settings
- Modify Usable Capacity Settings
- Modify Usage Calculation Settings
- Modify the Criteria for Powered-Off and Idle Virtual Machine State
- Modify the Criteria for Oversized and Undersized Virtual Machines
- Modify the Criteria for Underused and Stressed Capacity
- Select Which Badges Generate Alerts
- Modify Trend and Forecast Analysis Settings
- Modify an Existing Policy
- Modify Summary, Views, and Reports Settings
- Create a New Policy
- Monitor the Performance of vCenter Operations Manager
- Index

Device-Specific Faults
Faults occur on a resource, but at times can represent a problem that is more specific. For example, a vSphere
host can lose network connectivity, but the problem is also specific to a NIC within the host. Another example
is when a vSphere host loses connectivity to a storage device. The fault manifests itself on the host, but it is
also specific to the storage device to which the connectivity was lost.
These types of device-specific faults are a subcategory of problem events. Device-specific faults exhibit a unique
behavior. A fault alert of this type consists of all devices exhibiting the problem. This list of devices changes
dynamically, based on devices entering and leaving the problem state. The fault state is restored when no
devices exhibit a problem. This behavior ensures that the fault on a resource is cleared only if all traces of the
problem are resolved completely.
For example, consider a host with two physical NICs, A and B. Network connectivity on NIC A is lost.
vCenter Operations Manager creates a fault with NIC A listed as an affected device. If NIC B encounters the
same problem, it is added to the device list on the already created fault. Whenever NIC A or NIC B have a
restored connection, they are removed from the fault, and the fault is cleared after both NICs are connected.
The behavior of device-specific faults is completely different from that of alarms in vCenter Server. vCenter
alarms are agnostic to devices and are generic. They are created and cleared regardless of which devices have
a problem. This vCenter Server alarm behavior can lead to discrepancies between vCenter alarms and
vCenter Operations Manager faults.
Monitoring Alerts in vCenter Operations Manager
The alerts workflow in a vCenter Operations Manager virtual environment involves identifying alerts to
respond to, maintaining alerts, and identifying alert trends.
Alerts in vCenter Operations Manager are available for all of the minor badges. Alert messages provide an
alternate path to identify and resolve issues.
What Is an Alert in vCenter Operations Manager
vCenter Operations Manager generates alerts when events occur on the monitored objects, when data analysis
indicates deviations from normal metric values, or when a problem occurs with one of the
vCenter Operations Manager components.
The Alert Volume Chart
The Alert Volume chart is a graphical representation of the number of alerts that were activated during the
last 7 days. The color coding in the graph represents the level of criticality of alerts.
Alert Icon Description
Critical alert. You must act immediately.
Immediate alert. Act as soon as possible.
Warning alert. Check the condition of the selected object.
Information alert.
The Alert Volume chart helps you visually assess what is the overall volume of alerts triggered in your
environment, what is the ratio between alerts of different criticality, and what criticality level prevails in your
environment.
VMware vCenter Operations Manager Getting Started Guide
64 VMware, Inc.