
5.7
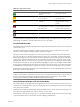
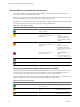
Table Of Contents
- VMware vCenter Operations Manager Getting Started Guide
- Contents
- VMware vCenter Operations Manager Getting Started Guide
- Introducing Key Features and Concepts
- Beginning to Monitor the Virtual Environment
- Object Type Icons in the Inventory Pane
- Badge Concepts for vCenter Operations Manager
- Major Badges in vCenter Operations Manager
- Working with Metrics and Charts on the All Metrics Tab
- Viewing Members and Relationships in the Monitored Environment
- Check the Performance of Your Virtual Environment
- Balancing the Resources in Your Virtual Environment
- Find an ESX Host that Has Resources for More Virtual Machines
- Find a Cluster that Has Resources Available for More Virtual Machines
- Ranking the Health, Risk, and Efficiency Scores
- View the Compliance Details
- View a List of Members
- Overview of Relationships
- Troubleshooting with vCenter Operations Manager
- Troubleshooting Overview
- Troubleshooting a Help Desk Problem
- Troubleshooting an Alert
- Finding Problems in the Virtual Environment
- Finding the Cause of the Problem
- Determine Whether the Environment Operates as Expected
- Identify the Source of Performance Degradation
- Identify the Underlying Memory Resource Problem for a Virtual Machine
- Identify the Underlying Memory Resource Problem for Clusters and Hosts
- Identify the Top Resource Consumers
- Identify Events that Occurred when an Object Experienced Performance Degradation
- Determine the Extent of a Performance Degradation
- Determine the Timeframe and Nature of a Health Issue
- Determine the Cause of a Problem with a Specific Object
- Fix the Cause of the Problem
- Assessing Risk and Efficiency in vCenter Operations Manager
- Analyzing Data for Capacity Risk
- Determine When an Object Might Run Out of Resources
- Identify Clusters with the Space for Virtual Machines
- Investigating Abnormal Host Health
- Identify Datastores with Space for Virtual Machines
- Identify Datastores with Wasted Space
- Address a Problem with a Specific Virtual Machine
- Identify the Virtual Machines with Resource Waste Across Datastores
- Address a Problem with a Specific Datastore
- Identify the Host and Datastore with the Highest Latency
- Optimizing Data for Capacity
- Determine How Efficiently You Use the Virtual Infrastructure
- Identify the Consolidation Ratio Trend for a Datacenter or Cluster
- Determine Reclaimable Resources from Underused Objects
- Assess Virtual Machine Capacity Use
- Assess Virtual Machine Optimization Data
- Identify Powered-Off Virtual Machines to Optimize Data
- Identify Idle Virtual Machines to Optimize Capacity
- Identify Oversized Virtual Machines to Optimize Data
- Determine the Trend of Waste for a Virtual Machine
- Forecasting Data for Capacity Risk
- Create Capacity Scenarios for Virtual Machines With New Profiles
- Create Capacity Scenarios for Virtual Machines With Existing Profiles
- Create a Hardware Change Scenario
- Create a What-If Scenario to Remove Virtual Machines
- Combine the Results of What-If Scenarios
- Compare the Results of What-If Scenarios
- Delete a Scenario from the What-If Scenarios List
- Analyzing Data for Capacity Risk
- Working with Faults and Alerts
- Working with Groups
- Set How Data Appears in vCenter Operations Manager
- Create a New Policy
- Set the General Parameters of a Policy
- Associate a Policy with One or More Groups
- Customize Badge Thresholds for Infrastructure Objects
- Customize Badge Thresholds for Virtual Machine Objects
- Customize the Badge Thresholds for Groups
- Modify Capacity and Time Remaining Settings
- Modify Usable Capacity Settings
- Modify Usage Calculation Settings
- Modify the Criteria for Powered-Off and Idle Virtual Machine State
- Modify the Criteria for Oversized and Undersized Virtual Machines
- Modify the Criteria for Underused and Stressed Capacity
- Select Which Badges Generate Alerts
- Modify Trend and Forecast Analysis Settings
- Modify an Existing Policy
- Modify Summary, Views, and Reports Settings
- Create a New Policy
- Monitor the Performance of vCenter Operations Manager
- Index

The Anomalies score ranges between 0 (good) and 100 (bad). The badge changes its color based on the badge
score thresholds that are set by the vCenter Operations Manager administrator.
Table 2-4. Object Anomalies States
Badge Icon Description User Action
The Anomalies score is normal. No attention required.
The Anomalies score exceeds the
normal range.
Check the Details tab to identify
what causes the abnormal
number of anomalies, and take
appropriate action.
The Anomalies score is very
high.
Check the Details tab to identify
the cause of the abnormal
behaviour, and take appropriate
action as soon as possible.
Most of the metrics are beyond
their thresholds. This object
might not be working properly
or might stop working soon.
Check the Details tab, and act
immediately to avoid or correct
problems.
No data is available.
The object is offline.
A vCenter Operations Manager administrator can change the badge score thresholds. For example, a green
Anomalies badge can indicate a score below 60 instead of 50, as set be default.
Using the Faults Badge Under the Health Badge
The Faults badge measures the degree of problems that the object might experience based on events retrieved
from the vCenter Server.
The events that might generate faults include the loss of redundancy in NICs or HBAs, memory checksum
errors, high availability failover, or Common Information Model (CIM) events, which require your immediate
attention.
NOTE vCenter Operations Manager calculates the Faults score for the World object by using the Faults scores
of the vCenter Server systems, the ESX hosts and clusters, and the datastores that belong to the World inventory.
Therefore, if you have one vCenter Server with a Faults score of 100 and another vCenter Server with a Faults
score of 0, this might not necessarily result in a Faults score of 50 for the World object. The final Faults score
for the World object also depends on the number of datastores, ESX hosts and clusters in the environment, and
the Fault scores of these objects.
Fault scores of virtual machines are not taken into account when calculating the Faults score for the World
object.
While the Faults score ranges between 0 to 100, the badge changes color based on the badge score thresholds
that are set by the vCenter Operations Manager administrator. For example, a green Faults badge can indicate
a score below 40 instead of a score below 25 (the system default).
Chapter 2 Beginning to Monitor the Virtual Environment
VMware, Inc. 15