
5.7
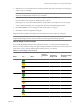
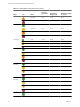
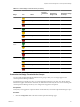
Table Of Contents
- VMware vCenter Operations Manager Getting Started Guide
- Contents
- VMware vCenter Operations Manager Getting Started Guide
- Introducing Key Features and Concepts
- Beginning to Monitor the Virtual Environment
- Object Type Icons in the Inventory Pane
- Badge Concepts for vCenter Operations Manager
- Major Badges in vCenter Operations Manager
- Working with Metrics and Charts on the All Metrics Tab
- Viewing Members and Relationships in the Monitored Environment
- Check the Performance of Your Virtual Environment
- Balancing the Resources in Your Virtual Environment
- Find an ESX Host that Has Resources for More Virtual Machines
- Find a Cluster that Has Resources Available for More Virtual Machines
- Ranking the Health, Risk, and Efficiency Scores
- View the Compliance Details
- View a List of Members
- Overview of Relationships
- Troubleshooting with vCenter Operations Manager
- Troubleshooting Overview
- Troubleshooting a Help Desk Problem
- Troubleshooting an Alert
- Finding Problems in the Virtual Environment
- Finding the Cause of the Problem
- Determine Whether the Environment Operates as Expected
- Identify the Source of Performance Degradation
- Identify the Underlying Memory Resource Problem for a Virtual Machine
- Identify the Underlying Memory Resource Problem for Clusters and Hosts
- Identify the Top Resource Consumers
- Identify Events that Occurred when an Object Experienced Performance Degradation
- Determine the Extent of a Performance Degradation
- Determine the Timeframe and Nature of a Health Issue
- Determine the Cause of a Problem with a Specific Object
- Fix the Cause of the Problem
- Assessing Risk and Efficiency in vCenter Operations Manager
- Analyzing Data for Capacity Risk
- Determine When an Object Might Run Out of Resources
- Identify Clusters with the Space for Virtual Machines
- Investigating Abnormal Host Health
- Identify Datastores with Space for Virtual Machines
- Identify Datastores with Wasted Space
- Address a Problem with a Specific Virtual Machine
- Identify the Virtual Machines with Resource Waste Across Datastores
- Address a Problem with a Specific Datastore
- Identify the Host and Datastore with the Highest Latency
- Optimizing Data for Capacity
- Determine How Efficiently You Use the Virtual Infrastructure
- Identify the Consolidation Ratio Trend for a Datacenter or Cluster
- Determine Reclaimable Resources from Underused Objects
- Assess Virtual Machine Capacity Use
- Assess Virtual Machine Optimization Data
- Identify Powered-Off Virtual Machines to Optimize Data
- Identify Idle Virtual Machines to Optimize Capacity
- Identify Oversized Virtual Machines to Optimize Data
- Determine the Trend of Waste for a Virtual Machine
- Forecasting Data for Capacity Risk
- Create Capacity Scenarios for Virtual Machines With New Profiles
- Create Capacity Scenarios for Virtual Machines With Existing Profiles
- Create a Hardware Change Scenario
- Create a What-If Scenario to Remove Virtual Machines
- Combine the Results of What-If Scenarios
- Compare the Results of What-If Scenarios
- Delete a Scenario from the What-If Scenarios List
- Analyzing Data for Capacity Risk
- Working with Faults and Alerts
- Working with Groups
- Set How Data Appears in vCenter Operations Manager
- Create a New Policy
- Set the General Parameters of a Policy
- Associate a Policy with One or More Groups
- Customize Badge Thresholds for Infrastructure Objects
- Customize Badge Thresholds for Virtual Machine Objects
- Customize the Badge Thresholds for Groups
- Modify Capacity and Time Remaining Settings
- Modify Usable Capacity Settings
- Modify Usage Calculation Settings
- Modify the Criteria for Powered-Off and Idle Virtual Machine State
- Modify the Criteria for Oversized and Undersized Virtual Machines
- Modify the Criteria for Underused and Stressed Capacity
- Select Which Badges Generate Alerts
- Modify Trend and Forecast Analysis Settings
- Modify an Existing Policy
- Modify Summary, Views, and Reports Settings
- Create a New Policy
- Monitor the Performance of vCenter Operations Manager
- Index

2 Create a new policy or open an existing policy for editing.
Option Description
To create a new policy
In the Manage Policies pane, click the Create Policy icon .
To modify an existing policy
In the Manage Policies pane, select the policy that you want to associate to
groups and click the Edit Policy icon .
3 In the Configure state-related thresholds section, click 4b Oversized and undersized VMs.
4 Change the settings for oversized and undersized virtual machines.
Option Description
VMs are oversized when:
Amount of CPU demand below
Considers the virtual machine oversized when the following conditions are
met:
n
CPU use is less than the percentage of its allocated capacity as indicated
in this field.
n
Duration of CPU activity under this threshold compared to total time
evaluated meets the % oversized threshold.
Amount of memory demand below
Considers the virtual machine oversized when the following conditions are
met:
n
Memory use is less than the percentage of its allocated capacity as
indicated in this field.
n
Duration of memory activity under this threshold compared to total time
evaluated meets the % oversized threshold.
is more than number% for the entire
range
Sets the amount of nonusage in the the entire environment defined by the %
oversized thresholds and the time range to analyze.
You define the time range in the Manage Display Settings section of the
Configuration dialog box.
VMs are undersized when:
Amount of CPU demand peaks
above
Considers the virtual machine undersized when the following conditions are
met:
n
CPU demand is more than the percentage of its allocated capacity as
indicated in this field.
n
Duration of CPU activity under this threshold compared to total time
evaluated meets the % undersized threshold.
Amount of memory demand peaks
above
Considers the virtual machine undersized when the following conditions are
met:
n
Memory use is more than the percentage of its allocated capacity as
indicated in this field.
n
Duration of memory activity under this threshold compared to total time
evaluated meets the % undersized threshold.
is more than number% for
Sets the amount of use in the entire environment defined by the % undersized
threshold and the time range to analyze.
Any number hour period
Sets the time range to analyze as a period of hours.
Entire range
Sets the time range to analyze as the range defined in the Manage Display
Settings section of the Configuration dialog box.
5 Click OK or Finish to save your settings, or select another option to configure.
6 Click Done to close the Configuration dialog box.
The criteria for oversized and undersized virtual machines are reconfigured.
VMware vCenter Operations Manager Getting Started Guide
100 VMware, Inc.