
5.7.1
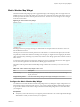
Table Of Contents
- VMware vCenter Operations Manager Getting Started Guide
- Contents
- VMware vCenter Operations Manager Getting Started Guide
- Introducing Custom User Interface Features and Concepts
- Introducing Common Tasks
- Logging In and Using vCenter Operations Manager
- Monitoring Day-to-Day Operations
- Handling Alerts
- Optimizing Your Resources
- Designing Your Workspace
- Working with Dashboards
- Create a Dashboard
- Clone a Dashboard
- Edit a Dashboard
- Delete a Dashboard
- Create a Dashboard Template
- Hide a Dashboard Tab
- Change the Order of Dashboard Tabs
- Delete a Dashboard Template
- Configure Dashboard Switching
- Share a Dashboard
- Stop Sharing a Dashboard
- Export a Dashboard
- Import a Dashboard
- vSphere Dashboards
- Working with Widgets
- Working with Dashboards
- Using and Configuring Widgets
- Edit a Widget Configuration
- Supported Widget Interactions
- Configure Widget Interactions
- Advanced Health Tree Widget
- Alerts Widget
- Application Detail Widget
- Application Overview Widget
- Configuration Overview Widget
- Custom Relationship Widget
- Data Distribution Analysis Widget
- Generic Scoreboard Widget
- GEO Widget
- Health Status Widget
- Health Tree Widget
- Health-Workload Scoreboard Widget
- Heat Map Widget
- Mashup Charts Widget
- Metric Graph Widget
- Metric Graph (Rolling View) Widget
- Metric Selector Widget
- Metric Sparklines Widget
- Metric Weather Map Widget
- Resources Widget
- Root Cause Ranking Widget
- Tag Selector Widget
- Text Widget
- Top-N Analysis Widget
- VC Relationship Widget
- VC Relationship (Planning) Widget
- Define Metric Sets for a Widget
- Index

n
Open the Edit Widget window for the Metric Weather Map widget. See “Edit a Widget Configuration,”
on page 54.
Procedure
1 Configure the appearance of the widget display.
Option Action
Image Redraw Rate
Select how often the widget gets new metric data and updates the display.
This option is the same as the Widget Refresh Interval for other widgets.
Metric History
Select the time period for the weather map, from the previous hour to the
last 30 days.
Metric Sample Increment
Select the interval between metric readings. For example, if you set this
option to one minute and set the Metric History to one hour, the widget
has a total of 60 readings for each metric.
Group by
To group the resources by tag value, select the tag.
Sort by
To sort the resources by resource name or metric value, select Resource
name or Metric value.
Frame transition interval
Type how fast the icons change to show each new value. You can select the
interval between frames or the number of frames per second (fps).
Start over delay (seconds)
The number of seconds for the display to remain static when it reaches the
end of the Metric History period, the most current readings, before it starts
over again from the beginning.
Colors
Select the colors in the weather map. Click each of the small blocks under
the color bar to set the color for minimum, middle, and maximum values.
The bar shows the color range for intermediate values.
You can also set the values to match the high and low end of the color
range. If you do not type values in the Min Value and Max Value text
boxes, vCenter Operations Manager maps the actual minimum and
maximum values of the metric over the time period to the end colors. If
you set a minimum or maximum value, any metric at or beyond that value
appears in the end color.
2 (Optional) To filter the resource kinds in the Resource Kinds pane, select one or more tag values in the
left pane.
You can use icons on the toolbar at the top of the list to collapse, expand, and deselect all of the tags in
the list.
When you select more than one value for the same tag, the list includes resource kinds that have either
value. When you select values for two or more tags, the list includes only resource kinds that have all of
the values that you select.
3 In the Resource Kinds pane, select a resource kind.
You can type all or part of the resource kind name in the Search text box and click the right angle
bracket (>) to search for a specific resource kind.
The metrics for the resource kind appear in the Metrics pane.
4 In the Metrics pane, select the metric to show in the widget.
You can click the Show Common Metrics icon at the top of the list to show only metrics that are shared
by all resources of the selected resource kind. You can also type all or part of the metric name in the
Search text box and click the right angle bracket (>) to search for a specific metric.
5 Click OK to save the widget configuration.
6 (Optional) To verify the filtering settings that you configured for the widget, click the Display Filtering
Criteria icon on the widget's toolbar.
The filtering criteria appears in a pop-up window.
VMware vCenter Operations Manager Getting Started Guide
98 VMware, Inc.