
5.7.1
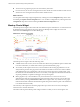
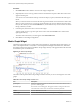
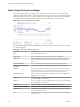
Table Of Contents
- VMware vCenter Operations Manager Getting Started Guide
- Contents
- VMware vCenter Operations Manager Getting Started Guide
- Introducing Custom User Interface Features and Concepts
- Introducing Common Tasks
- Logging In and Using vCenter Operations Manager
- Monitoring Day-to-Day Operations
- Handling Alerts
- Optimizing Your Resources
- Designing Your Workspace
- Working with Dashboards
- Create a Dashboard
- Clone a Dashboard
- Edit a Dashboard
- Delete a Dashboard
- Create a Dashboard Template
- Hide a Dashboard Tab
- Change the Order of Dashboard Tabs
- Delete a Dashboard Template
- Configure Dashboard Switching
- Share a Dashboard
- Stop Sharing a Dashboard
- Export a Dashboard
- Import a Dashboard
- vSphere Dashboards
- Working with Widgets
- Working with Dashboards
- Using and Configuring Widgets
- Edit a Widget Configuration
- Supported Widget Interactions
- Configure Widget Interactions
- Advanced Health Tree Widget
- Alerts Widget
- Application Detail Widget
- Application Overview Widget
- Configuration Overview Widget
- Custom Relationship Widget
- Data Distribution Analysis Widget
- Generic Scoreboard Widget
- GEO Widget
- Health Status Widget
- Health Tree Widget
- Health-Workload Scoreboard Widget
- Heat Map Widget
- Mashup Charts Widget
- Metric Graph Widget
- Metric Graph (Rolling View) Widget
- Metric Selector Widget
- Metric Sparklines Widget
- Metric Weather Map Widget
- Resources Widget
- Root Cause Ranking Widget
- Tag Selector Widget
- Text Widget
- Top-N Analysis Widget
- VC Relationship Widget
- VC Relationship (Planning) Widget
- Define Metric Sets for a Widget
- Index

Table 4‑6. Mashup Charts Widget Toolbar Icons
Icon Description
Allow zoom by X axis When you click this icon, zooming the graph affects the X axis. You can use Zoom by X and
Zoom by Y simultaneously.
Allow zoom by Y axis When you click this icon, zooming the graph affects the Y axis. You can use Zoom by X and
Zoom by Y simultaneously.
Zoom to fit Changes all graphs to show the entire time period and value range.
Zoom the view Click this icon and drag to outline a part of the hierarchy. The display zooms to show only
the outlined section.
Pan When you click this icon, dragging in the graph changes the time period. It does not zoom
the graph.
Point Values Click this icon and point to a graphed KPI data point to see its time and exact value. You can
show values only if the selected time period is 24 hours or less.
Show All Alerts Click this icon to show both active and inactive alerts after clicking the Show Only Active
Alerts or Show Only Inactive Alerts icon. Inactive alerts appear grey in the display.
Show Only Active
Alerts
Filter the alerts to show only active alerts.
Show Only Inactive
Alerts
Filter the alerts to show only inactive alerts.
Chart Controls See Table 4-7.
Date Controls Select the time period to show on the graphs. You can select a period in the top box, or select
start and end dates and times.
You use the Chart Controls drop-down menu at the top of the widget to select which charts to view.
Table 4‑7. Chart Controls
Menu Item Description
Show Charts Select the types of graphs to include in the widget.
Layers Select the types and subtypes of alerts to show on the metric graph. You can show change
events, which are user-defined notifications that the vCenter Operations Manager
OpenAPI sends to vCenter Operations Manager.
Show in Stacked Mode Changes the Anomaly Count Graph to a single stacked graph that shows anomalies for all
selected resources.
Resources Select the resources to include in the Anomaly Count Graph.
KPIs Select the KPI for which to include metric graphs.
Configure the Mashup Charts Widget
You can define the resource that the Mashup Charts widget shows by editing the widget configuration.
You can also configure other widgets to provide a resource to the Mashup Charts widget. See “Configure
Widget Interactions,” on page 61.
Prerequisites
n
Verify that you have the necessary access rights to perform this task. Your vCenter Operations Manager
administrator can tell you which actions you can perform.
n
Open the Edit Widget window for the Mashup Charts widget. See “Edit a Widget Configuration,” on
page 54.
Chapter 4 Using and Configuring Widgets
VMware, Inc. 85