
5.7.1
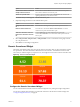
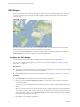
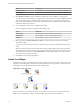
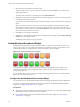
Table Of Contents
- VMware vCenter Operations Manager Getting Started Guide
- Contents
- VMware vCenter Operations Manager Getting Started Guide
- Introducing Custom User Interface Features and Concepts
- Introducing Common Tasks
- Logging In and Using vCenter Operations Manager
- Monitoring Day-to-Day Operations
- Handling Alerts
- Optimizing Your Resources
- Designing Your Workspace
- Working with Dashboards
- Create a Dashboard
- Clone a Dashboard
- Edit a Dashboard
- Delete a Dashboard
- Create a Dashboard Template
- Hide a Dashboard Tab
- Change the Order of Dashboard Tabs
- Delete a Dashboard Template
- Configure Dashboard Switching
- Share a Dashboard
- Stop Sharing a Dashboard
- Export a Dashboard
- Import a Dashboard
- vSphere Dashboards
- Working with Widgets
- Working with Dashboards
- Using and Configuring Widgets
- Edit a Widget Configuration
- Supported Widget Interactions
- Configure Widget Interactions
- Advanced Health Tree Widget
- Alerts Widget
- Application Detail Widget
- Application Overview Widget
- Configuration Overview Widget
- Custom Relationship Widget
- Data Distribution Analysis Widget
- Generic Scoreboard Widget
- GEO Widget
- Health Status Widget
- Health Tree Widget
- Health-Workload Scoreboard Widget
- Heat Map Widget
- Mashup Charts Widget
- Metric Graph Widget
- Metric Graph (Rolling View) Widget
- Metric Selector Widget
- Metric Sparklines Widget
- Metric Weather Map Widget
- Resources Widget
- Root Cause Ranking Widget
- Tag Selector Widget
- Text Widget
- Top-N Analysis Widget
- VC Relationship Widget
- VC Relationship (Planning) Widget
- Define Metric Sets for a Widget
- Index

Option Description
Pagination Number
Sets the number of resources that appear on each page of the widget.
Period Length
Sets the amount of time that appears on the health graph for each resource.
3 Select Health or Custom to specify whether the widget shows resource health or a custom metric.
You can search for a custom metric by typing the metric name in the text box next to Custom. When the
correct metric name appears, select it from the drop-down menu. You can also open the drop-down
menu, scroll through the list of available metrics, and select a metric. Pagination controls are provided
at the bottom of the drop-down list.
4 If you configured a custom metric, configure metric ranges.
You can configure the ranges in ascending or descending order.
Option Description
Yellow Bound
Type the highest or lowest value that should be yellow.
Orange Bound
Type the highest or lowest value that should be orange.
Red Bound
Type the highest or lowest value that should be red.
5 Select tag values in the Select which tags to show list to show only resources that have certain tag
values in the widget.
You can use icons on the toolbar at the top of the list to collapse, expand, and deselect all of the tags in
the list.
When you select more than one value for the same tag, the widget includes resources that have either
value. When you select values for two or more tags, the widget includes only resources that have all of
the selected values. When you click the Invert Result icon, the widget includes only resources that do
not match the tag values that you select.
6 Click OK to save the widget configuration.
Health Tree Widget
The Health Tree widget shows the section of your resource hierarchy around a resource that you select. The
widget shows all of the parent container resources that hold the resource. If you select a container resource,
the widget shows all of the child resources that the container holds.
Figure 4‑11. Health Tree Widget
Unless you are in Pan or Zoom the view mode, you can point to a resource to show its name and current
health. You can double-click a resource to shift the display to show its parents and children.
VMware vCenter Operations Manager Getting Started Guide
78 VMware, Inc.