
5.7.1
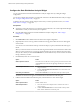
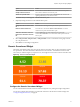
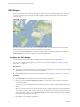
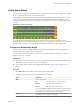
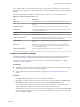
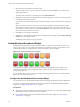
Table Of Contents
- VMware vCenter Operations Manager Getting Started Guide
- Contents
- VMware vCenter Operations Manager Getting Started Guide
- Introducing Custom User Interface Features and Concepts
- Introducing Common Tasks
- Logging In and Using vCenter Operations Manager
- Monitoring Day-to-Day Operations
- Handling Alerts
- Optimizing Your Resources
- Designing Your Workspace
- Working with Dashboards
- Create a Dashboard
- Clone a Dashboard
- Edit a Dashboard
- Delete a Dashboard
- Create a Dashboard Template
- Hide a Dashboard Tab
- Change the Order of Dashboard Tabs
- Delete a Dashboard Template
- Configure Dashboard Switching
- Share a Dashboard
- Stop Sharing a Dashboard
- Export a Dashboard
- Import a Dashboard
- vSphere Dashboards
- Working with Widgets
- Working with Dashboards
- Using and Configuring Widgets
- Edit a Widget Configuration
- Supported Widget Interactions
- Configure Widget Interactions
- Advanced Health Tree Widget
- Alerts Widget
- Application Detail Widget
- Application Overview Widget
- Configuration Overview Widget
- Custom Relationship Widget
- Data Distribution Analysis Widget
- Generic Scoreboard Widget
- GEO Widget
- Health Status Widget
- Health Tree Widget
- Health-Workload Scoreboard Widget
- Heat Map Widget
- Mashup Charts Widget
- Metric Graph Widget
- Metric Graph (Rolling View) Widget
- Metric Selector Widget
- Metric Sparklines Widget
- Metric Weather Map Widget
- Resources Widget
- Root Cause Ranking Widget
- Tag Selector Widget
- Text Widget
- Top-N Analysis Widget
- VC Relationship Widget
- VC Relationship (Planning) Widget
- Define Metric Sets for a Widget
- Index

5 In the Metric Selector With Resource Selection pane, select the metrics to show in the widget.
Option Action
Select a specific metric
Double-click the metric.
Select multiple metrics
a Press Ctrl+click to select multiple metrics or Shift+click to select a
range of metrics.
b Click the Perform Multi-Select icon on the toolbar at the top of the
Metric Selector With Resource Selection pane.
List the metrics that are common to
multiple selected resources
Click the Show Common Metrics icon on the toolbar at the top of the
Metric Selector With Resource Selection pane.
Search for a specific metric
Type all or part of the metric name in the Search text box and click > to
search for the metric.
The metrics that you select appear in the Selected Metrics pane.
6 (Optional) Manage the metrics in the Selected Metrics pane.
Option Action
Change the order of a metric in the
list
Select the metric and drag it to another position in the list.
Remove a metric from the list
Select the metric and click the Remove Selected Metrics icon on the
toolbar at the top of the Selected Metrics pane.
Select all of the metrics in the list
Click the Select All icon on the toolbar at the top of the Selected Metrics
pane.
Remove all of the metrics from the
list
Click the Clear Selections icon on the toolbar at the top of the Selected
Metrics pane.
7 Set values for each metric in the Selected Metrics pane.
You can set a value for one metric and apply it to all metrics by clicking the Apply to all icon.
Option Action
Box Label
Type a label to include in the box for the metric.
Measurement Unit
Type the text that appears after the metric value in the box.
Yellow Bound
Type the highest or lowest value that should be yellow.
Orange Bound
Type the highest or lowest value that should orange.
Red Bound
Type the highest or lowest value that should be red.
You cannot edit the color boundaries for health-related metrics, such as vCenter Operations Generated
| Self - Health Score, in the Selected Metrics pane. The color boundaries for these metrics are configured
for you when you save the widget configuration. vCenter Operations Manager obtains color range
values for health-related metrics from global settings (select Admin > Global Settings).
8 Click OK to save the widget configuration.
Chapter 4 Using and Configuring Widgets
VMware, Inc. 75