
5.7.1

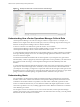
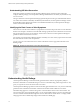
Table Of Contents
- VMware vCenter Operations Manager Getting Started Guide
- Contents
- VMware vCenter Operations Manager Getting Started Guide
- Introducing Custom User Interface Features and Concepts
- Introducing Common Tasks
- Logging In and Using vCenter Operations Manager
- Monitoring Day-to-Day Operations
- Handling Alerts
- Optimizing Your Resources
- Designing Your Workspace
- Working with Dashboards
- Create a Dashboard
- Clone a Dashboard
- Edit a Dashboard
- Delete a Dashboard
- Create a Dashboard Template
- Hide a Dashboard Tab
- Change the Order of Dashboard Tabs
- Delete a Dashboard Template
- Configure Dashboard Switching
- Share a Dashboard
- Stop Sharing a Dashboard
- Export a Dashboard
- Import a Dashboard
- vSphere Dashboards
- Working with Widgets
- Working with Dashboards
- Using and Configuring Widgets
- Edit a Widget Configuration
- Supported Widget Interactions
- Configure Widget Interactions
- Advanced Health Tree Widget
- Alerts Widget
- Application Detail Widget
- Application Overview Widget
- Configuration Overview Widget
- Custom Relationship Widget
- Data Distribution Analysis Widget
- Generic Scoreboard Widget
- GEO Widget
- Health Status Widget
- Health Tree Widget
- Health-Workload Scoreboard Widget
- Heat Map Widget
- Mashup Charts Widget
- Metric Graph Widget
- Metric Graph (Rolling View) Widget
- Metric Selector Widget
- Metric Sparklines Widget
- Metric Weather Map Widget
- Resources Widget
- Root Cause Ranking Widget
- Tag Selector Widget
- Text Widget
- Top-N Analysis Widget
- VC Relationship Widget
- VC Relationship (Planning) Widget
- Define Metric Sets for a Widget
- Index

Introducing Custom User Interface
Features and Concepts 1
vCenter Operations Manager collects performance data from monitored software and hardware resources in
your enterprise and provides predictive analysis and real-time information about problems. The Custom
user interface presents data and analysis through alerts, in configurable dashboards, on predefined pages,
and in several predefined reports.
Before you start using the Custom user interface, become familiar with key features, concepts, and
terminology.
This chapter includes the following topics:
n
“Viewing Resources,” on page 7
n
“Understanding How vCenter Operations Manager Collects Data,” on page 8
n
“Understanding Alerts,” on page 8
n
“Understanding Health Ratings,” on page 10
n
“Monitoring Virtual Resources,” on page 11
n
“Analyzing Performance and Capacity,” on page 13
Viewing Resources
In vCenter Operations Manager, a resource is an entity in your computing environment for which
vCenter Operations Manager collects data. A resource can be a single entity, such as a router or database, or
a container that holds other resources.
Applications and tiers are types of container resources. An application defines an interdependent set of
hardware and software components. A tier is a group of resources that performs a specific task in an
application. An application can contain multiple tiers. With applications and tiers, you can combine, track,
and analyze metrics for related resources over a period of time.
To make resources easier to find in the Custom user interface, an administrator assigns resources to resource
tag values. A resource tag is a type of information, and a resource tag value is an individual instance of that
type of information.
You can view resources in many places in the Custom user interface, including the Environment Overview
page. The list on the left side of the Environment Overview page contains the resource tags and resource tag
values. The List tab contains the resources.
In the example, the resource tag value called VMware vCenter Operations is selected in the left pane under
the Application resource tag, and the List tab shows the resources assigned to the VMware vCenter
Operations resource tag value. The resources are tiers in the VMware vCenter Operations application.
VMware, Inc.
7