
5.7.1
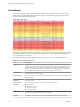
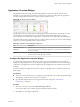
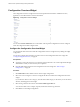
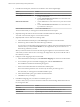
Table Of Contents
- VMware vCenter Operations Manager Getting Started Guide
- Contents
- VMware vCenter Operations Manager Getting Started Guide
- Introducing Custom User Interface Features and Concepts
- Introducing Common Tasks
- Logging In and Using vCenter Operations Manager
- Monitoring Day-to-Day Operations
- Handling Alerts
- Optimizing Your Resources
- Designing Your Workspace
- Working with Dashboards
- Create a Dashboard
- Clone a Dashboard
- Edit a Dashboard
- Delete a Dashboard
- Create a Dashboard Template
- Hide a Dashboard Tab
- Change the Order of Dashboard Tabs
- Delete a Dashboard Template
- Configure Dashboard Switching
- Share a Dashboard
- Stop Sharing a Dashboard
- Export a Dashboard
- Import a Dashboard
- vSphere Dashboards
- Working with Widgets
- Working with Dashboards
- Using and Configuring Widgets
- Edit a Widget Configuration
- Supported Widget Interactions
- Configure Widget Interactions
- Advanced Health Tree Widget
- Alerts Widget
- Application Detail Widget
- Application Overview Widget
- Configuration Overview Widget
- Custom Relationship Widget
- Data Distribution Analysis Widget
- Generic Scoreboard Widget
- GEO Widget
- Health Status Widget
- Health Tree Widget
- Health-Workload Scoreboard Widget
- Heat Map Widget
- Mashup Charts Widget
- Metric Graph Widget
- Metric Graph (Rolling View) Widget
- Metric Selector Widget
- Metric Sparklines Widget
- Metric Weather Map Widget
- Resources Widget
- Root Cause Ranking Widget
- Tag Selector Widget
- Text Widget
- Top-N Analysis Widget
- VC Relationship Widget
- VC Relationship (Planning) Widget
- Define Metric Sets for a Widget
- Index

Application Overview Widget
The Application Overview widget can list all of the applications and other container resources in the
enterprise, or only applications and container resources that you select. The widget lists only application
and other container resources that have at least one child container resource.
Figure 4‑4. Application Overview Widget
The Application Overview widget shows a health graph for the last 24 hours, the current health score, the
current health of child container resources, and the number of alerts for the application or container
resource itself. You can double-click an application or container resource to open its Resource Detail page.
The toolbar at the top of the Application Overview widget contains icons that you can use to select multiple
widgets or to search for applications and container resources.
Table 4‑4. Application Overview Widget Toolbar Icons
Icon Description
Perform Multi-Select
Interaction
If the Application Overview widget is a provider for another widget on the dashboard,
you can click this icon to select multiple applications or container resources to display in
the receiving widget.
Search To search for a particular application or container resource, type all or part of its name in
this text box and click the right angle bracket (>).
Configure the Application Overview Widget
You can filter the applications and container resources to show in the Application Overview widget by
editing the widget configuration. If you do not filter the applications and container resources in the widget
configuration, the Application Overview widget lists all of the applications and container resources in the
enterprise.
You cannot configure the Application Overview widget to accept applications or container resources from
other widgets.
Prerequisites
n
Verify that you have the necessary access rights to perform this task. Your vCenter Operations Manager
administrator can tell you which actions you can perform.
n
Open the Edit Widget window for the Application Overview widget. See “Edit a Widget
Configuration,” on page 54.
Procedure
1 Select one or more tag values in the Select which tags to filter list.
You can use toolbar icons to collapse, expand, and deselect all tags in the list.
2 Click OK to save the widget configuration.
Chapter 4 Using and Configuring Widgets
VMware, Inc. 67