
5.7.1
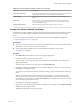
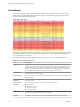
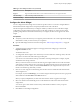
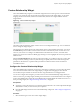
Table Of Contents
- VMware vCenter Operations Manager Getting Started Guide
- Contents
- VMware vCenter Operations Manager Getting Started Guide
- Introducing Custom User Interface Features and Concepts
- Introducing Common Tasks
- Logging In and Using vCenter Operations Manager
- Monitoring Day-to-Day Operations
- Handling Alerts
- Optimizing Your Resources
- Designing Your Workspace
- Working with Dashboards
- Create a Dashboard
- Clone a Dashboard
- Edit a Dashboard
- Delete a Dashboard
- Create a Dashboard Template
- Hide a Dashboard Tab
- Change the Order of Dashboard Tabs
- Delete a Dashboard Template
- Configure Dashboard Switching
- Share a Dashboard
- Stop Sharing a Dashboard
- Export a Dashboard
- Import a Dashboard
- vSphere Dashboards
- Working with Widgets
- Working with Dashboards
- Using and Configuring Widgets
- Edit a Widget Configuration
- Supported Widget Interactions
- Configure Widget Interactions
- Advanced Health Tree Widget
- Alerts Widget
- Application Detail Widget
- Application Overview Widget
- Configuration Overview Widget
- Custom Relationship Widget
- Data Distribution Analysis Widget
- Generic Scoreboard Widget
- GEO Widget
- Health Status Widget
- Health Tree Widget
- Health-Workload Scoreboard Widget
- Heat Map Widget
- Mashup Charts Widget
- Metric Graph Widget
- Metric Graph (Rolling View) Widget
- Metric Selector Widget
- Metric Sparklines Widget
- Metric Weather Map Widget
- Resources Widget
- Root Cause Ranking Widget
- Tag Selector Widget
- Text Widget
- Top-N Analysis Widget
- VC Relationship Widget
- VC Relationship (Planning) Widget
- Define Metric Sets for a Widget
- Index

Alerts Widget
The Alerts widget lists alerts for selected resources and provides a convenient way to view and manage
alerts. When you double-click an alert in the Alerts widget, the Alert Summary page appears and shows
more detailed information about the alert.
Figure 4‑2. Alerts Widget
If the Alerts widget accepts resources from another widget, it shows alerts for the provided resource and all
of its children unless the resource is an application. For applications, it shows alerts for the application, its
tiers, and the resources in the tiers.
The toolbar at the top of the Alerts widget contains icons that you can use to view alert information.
Table 4‑3. Alerts Widget Toolbar Icons
Icon Description
RSS Feed Lets you receive RSS feeds of issued alerts in your Web browser. Only alerts that appear in the
widget as it is configured are included. For example, if the widget is set to show alerts only for a
particular application, only alerts for that application are included in the RSS feed. The detail
message of an individual alert appears in the feed's headline. Depending on the RSS client that
you use, details for all anomalies related to the alert appear in the feed's body.
Reset Grid Sort Returns the grid to the default sort order, which is set on the Edit Alerts Widget window, if you
changed it when you used the widget.
Reset Interaction Returns the widget to its initial configured state and undoes any interactions made from another
providing widget.
Perform Multi-Select
Interaction
Press Ctrl+click to select multiple individual resources or Shift+click to select a range of resources
and click this icon.
Colorize Rows By
Alert Type
Sets the background color for each alert’s row based on its criticality.
n
Critical is Red
n
Immediate is Orange
n
Warning is Yellow
n
Information is Blue
Cancel Alert Cancels the selected alert. You can cancel only one alert at a time. You can cancel an alert only if
your user account name has administrative access rights.
Suspend Suspends the selected alerts. You can enter the number of minutes to suspend the alerts.
VMware vCenter Operations Manager Getting Started Guide
64 VMware, Inc.