
5.7.1
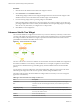
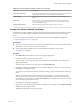
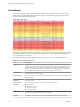
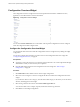
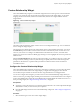
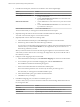
Table Of Contents
- VMware vCenter Operations Manager Getting Started Guide
- Contents
- VMware vCenter Operations Manager Getting Started Guide
- Introducing Custom User Interface Features and Concepts
- Introducing Common Tasks
- Logging In and Using vCenter Operations Manager
- Monitoring Day-to-Day Operations
- Handling Alerts
- Optimizing Your Resources
- Designing Your Workspace
- Working with Dashboards
- Create a Dashboard
- Clone a Dashboard
- Edit a Dashboard
- Delete a Dashboard
- Create a Dashboard Template
- Hide a Dashboard Tab
- Change the Order of Dashboard Tabs
- Delete a Dashboard Template
- Configure Dashboard Switching
- Share a Dashboard
- Stop Sharing a Dashboard
- Export a Dashboard
- Import a Dashboard
- vSphere Dashboards
- Working with Widgets
- Working with Dashboards
- Using and Configuring Widgets
- Edit a Widget Configuration
- Supported Widget Interactions
- Configure Widget Interactions
- Advanced Health Tree Widget
- Alerts Widget
- Application Detail Widget
- Application Overview Widget
- Configuration Overview Widget
- Custom Relationship Widget
- Data Distribution Analysis Widget
- Generic Scoreboard Widget
- GEO Widget
- Health Status Widget
- Health Tree Widget
- Health-Workload Scoreboard Widget
- Heat Map Widget
- Mashup Charts Widget
- Metric Graph Widget
- Metric Graph (Rolling View) Widget
- Metric Selector Widget
- Metric Sparklines Widget
- Metric Weather Map Widget
- Resources Widget
- Root Cause Ranking Widget
- Tag Selector Widget
- Text Widget
- Top-N Analysis Widget
- VC Relationship Widget
- VC Relationship (Planning) Widget
- Define Metric Sets for a Widget
- Index

Table 4‑1. Widget Interactions (Continued)
Receiving Widget Providing Widget 1 Providing Widget 2
VC Relationship
n
Advanced Health Tree
n
Alerts
n
Application Overview
n
Custom Relationship
n
Generic Scoreboard
n
Health Status
n
Health Tree
n
Health-Workload Scoreboard
n
Heat Map
n
Metric Sparklines
n
Resources
n
Root Cause Ranking
n
Top-N Analysis
n
VC Relationship (Planning)
VC Relationship Planning
n
Advanced Health Tree
n
Alerts
n
Application Overview
n
Custom Relationship
n
Generic Scoreboard
n
Health Status
n
Health Tree
n
Health-Workload Scoreboard
n
Heat Map
n
Metric Sparklines
n
Resources
n
Root Cause Ranking
n
Top-N Analysis
n
VC Relationship
Configure Widget Interactions
You can configure a widget to show information for resources, applications, tags, or metrics that you select
in another widget. For example, you can configure the Metric Sparklines widget to show a graph for a
metric that you select in the Metric Selector widget. Both widgets must appear on the same dashboard.
When you configure widget interaction, you specify the widget that provides the information, called the
providing widget, to the widget that shows the information, called the receiving widget.
For some widgets, you can define two providing widgets. For example, you can configure the Root Cause
Ranking widget to receive data from the Tag Selector widget and the Health Status widget. In this case, the
Root Cause Ranking widget shows root cause data for any resource that you select in the Health Status
widget or for resources that have the tag value that you select in the Tag Selector widget.
Widget interactions apply only to the dashboard where you define them. For example, on one dashboard,
the Root Cause Ranking widget might receive its resources from the Health Widget widget. On another
dashboard, the Root Cause Ranking widget might receive its resources from the Tag Selector widget.
Prerequisites
n
Verify that you have the necessary access rights to perform this task. Your vCenter Operations Manager
administrator can tell you which actions you can perform.
n
Become familiar with the widgets that can provide and receive data from other widgets. See
“Supported Widget Interactions,” on page 55.
Chapter 4 Using and Configuring Widgets
VMware, Inc. 61