
5.7.1
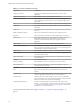
Table Of Contents
- VMware vCenter Operations Manager Getting Started Guide
- Contents
- VMware vCenter Operations Manager Getting Started Guide
- Introducing Custom User Interface Features and Concepts
- Introducing Common Tasks
- Logging In and Using vCenter Operations Manager
- Monitoring Day-to-Day Operations
- Handling Alerts
- Optimizing Your Resources
- Designing Your Workspace
- Working with Dashboards
- Create a Dashboard
- Clone a Dashboard
- Edit a Dashboard
- Delete a Dashboard
- Create a Dashboard Template
- Hide a Dashboard Tab
- Change the Order of Dashboard Tabs
- Delete a Dashboard Template
- Configure Dashboard Switching
- Share a Dashboard
- Stop Sharing a Dashboard
- Export a Dashboard
- Import a Dashboard
- vSphere Dashboards
- Working with Widgets
- Working with Dashboards
- Using and Configuring Widgets
- Edit a Widget Configuration
- Supported Widget Interactions
- Configure Widget Interactions
- Advanced Health Tree Widget
- Alerts Widget
- Application Detail Widget
- Application Overview Widget
- Configuration Overview Widget
- Custom Relationship Widget
- Data Distribution Analysis Widget
- Generic Scoreboard Widget
- GEO Widget
- Health Status Widget
- Health Tree Widget
- Health-Workload Scoreboard Widget
- Heat Map Widget
- Mashup Charts Widget
- Metric Graph Widget
- Metric Graph (Rolling View) Widget
- Metric Selector Widget
- Metric Sparklines Widget
- Metric Weather Map Widget
- Resources Widget
- Root Cause Ranking Widget
- Tag Selector Widget
- Text Widget
- Top-N Analysis Widget
- VC Relationship Widget
- VC Relationship (Planning) Widget
- Define Metric Sets for a Widget
- Index

Table 3‑1. Summary of Widgets (Continued)
Widget Name Description
Application Overview Shows the overall health and the health of each tier for one or more
applications.
Configuration Overview Shows statistics for the overall monitored environment.
Data Distribution Analysis Shows how often a metric had a particular value, as a percentage of all
values, within a given time period. It can also compare percentages for two
time periods.
Geo Shows the location of resources that are assigned to GEO Location tag values.
Health Status Shows health information for selected resources, or all resources that have a
selected tag.
Health Tree Shows the indicator for a selected resource, its parent resource, and its child
resources.
Health-Workload Scoreboard Shows color-coded health or workload scores for selected resources.
Heat Map Shows performance information for a selected application as a heat map.
Mashup Chart Brings together disparate pieces of information for a resource. It shows a
health chart, an anomaly count graph, and metric graphs for key
performance indicators (KPIs). This widget is typically used for an
application.
Metric Graph Shows the recent performance of selected metrics graphically.
Metric Graph (Rolling View) Cycles through selected metrics at an interval that you define and shows one
metric graph at a time. Miniature graphs, which you can expand, appear for
all selected metrics at the bottom of the widget.
Metric Selector Shows all metrics for the resources that are selected in the Resources widget.
Metric Sparklines Shows the values collected for one or more selected metrics graphically over
a time period that you select.
Metric Weather Map Uses changing colors to show the behavior of a selected metric over time for
multiple resources.
Resources Lists all defined resources.
Root Cause Ranking Shows the likely root causes for symptoms for a selected resource.
Generic Scoreboard Shows values for selected metrics, which are typically KPIs, with color
coding for defined value ranges.
Tag Selector Lists all defined resource tags.
Text Reads text from a Web page or text file and shows the text in the user
interface.
Top-N-Analysis Shows the top or bottom five metrics or resources in various categories, such
as the five applications that have the best or worth health score.
VC Relationship Shows the performance status of objects in your virtual environment and
their relationships. You can click an object to highlight its related objects and
double-click an object to view its Resource Detail page.
VC Relationship (Planning) Provides use and badge metric information (risk, time, capacity, stress,
efficiency, waste, and density) for the resources in your virtual environment.
You can use this information to plan for capacity upgrades or rebalance the
workload in your virtual infrastructure.
For detailed information about these widgets, see Chapter 4, “Using and Configuring Widgets,” on
page 53.
VMware vCenter Operations Manager Getting Started Guide
50 VMware, Inc.