
5.7.1
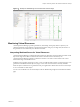
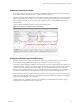

Table Of Contents
- VMware vCenter Operations Manager Getting Started Guide
- Contents
- VMware vCenter Operations Manager Getting Started Guide
- Introducing Custom User Interface Features and Concepts
- Introducing Common Tasks
- Logging In and Using vCenter Operations Manager
- Monitoring Day-to-Day Operations
- Handling Alerts
- Optimizing Your Resources
- Designing Your Workspace
- Working with Dashboards
- Create a Dashboard
- Clone a Dashboard
- Edit a Dashboard
- Delete a Dashboard
- Create a Dashboard Template
- Hide a Dashboard Tab
- Change the Order of Dashboard Tabs
- Delete a Dashboard Template
- Configure Dashboard Switching
- Share a Dashboard
- Stop Sharing a Dashboard
- Export a Dashboard
- Import a Dashboard
- vSphere Dashboards
- Working with Widgets
- Working with Dashboards
- Using and Configuring Widgets
- Edit a Widget Configuration
- Supported Widget Interactions
- Configure Widget Interactions
- Advanced Health Tree Widget
- Alerts Widget
- Application Detail Widget
- Application Overview Widget
- Configuration Overview Widget
- Custom Relationship Widget
- Data Distribution Analysis Widget
- Generic Scoreboard Widget
- GEO Widget
- Health Status Widget
- Health Tree Widget
- Health-Workload Scoreboard Widget
- Heat Map Widget
- Mashup Charts Widget
- Metric Graph Widget
- Metric Graph (Rolling View) Widget
- Metric Selector Widget
- Metric Sparklines Widget
- Metric Weather Map Widget
- Resources Widget
- Root Cause Ranking Widget
- Tag Selector Widget
- Text Widget
- Top-N Analysis Widget
- VC Relationship Widget
- VC Relationship (Planning) Widget
- Define Metric Sets for a Widget
- Index

Figure 1‑5. Example of Health Ratings on the Environment Overview Page
Monitoring Virtual Resources
vCenter Operations Manager provides performance, relationship, and capacity data for objects in your
virtual environment. It uses badges to represent derived metrics and give you a high-level, broad view of
the performance and condition of your virtual environment.
Interpreting Workload Scores for Virtual Resources
vCenter Operations Manager combines the metrics that show demand on virtual machines and other virtual
objects in a single value called a workload. These metrics include CPU use and memory use.
vCenter Operations Manager indicates workload as a numeric score and as a colored circle. The color is
based on the range of the workload score.
Workload scores typically range from 0 to 100. A score of 0 indicates that an object is not being used. A score
greater than 100 indicates that an object is trying to access more resources than are currently available.
When an object's workload score is greater than 100, you might need to allocate more resources to the object
or move some tasks to other objects.
You can view workload scores for virtual objects in the VC Relationship widget and on the Resource Detail
page.
Chapter 1 Introducing Custom User Interface Features and Concepts
VMware, Inc. 11