
5.7.1
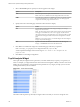
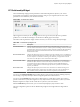
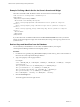
Table Of Contents
- VMware vCenter Operations Manager Getting Started Guide
- Contents
- VMware vCenter Operations Manager Getting Started Guide
- Introducing Custom User Interface Features and Concepts
- Introducing Common Tasks
- Logging In and Using vCenter Operations Manager
- Monitoring Day-to-Day Operations
- Handling Alerts
- Optimizing Your Resources
- Designing Your Workspace
- Working with Dashboards
- Create a Dashboard
- Clone a Dashboard
- Edit a Dashboard
- Delete a Dashboard
- Create a Dashboard Template
- Hide a Dashboard Tab
- Change the Order of Dashboard Tabs
- Delete a Dashboard Template
- Configure Dashboard Switching
- Share a Dashboard
- Stop Sharing a Dashboard
- Export a Dashboard
- Import a Dashboard
- vSphere Dashboards
- Working with Widgets
- Working with Dashboards
- Using and Configuring Widgets
- Edit a Widget Configuration
- Supported Widget Interactions
- Configure Widget Interactions
- Advanced Health Tree Widget
- Alerts Widget
- Application Detail Widget
- Application Overview Widget
- Configuration Overview Widget
- Custom Relationship Widget
- Data Distribution Analysis Widget
- Generic Scoreboard Widget
- GEO Widget
- Health Status Widget
- Health Tree Widget
- Health-Workload Scoreboard Widget
- Heat Map Widget
- Mashup Charts Widget
- Metric Graph Widget
- Metric Graph (Rolling View) Widget
- Metric Selector Widget
- Metric Sparklines Widget
- Metric Weather Map Widget
- Resources Widget
- Root Cause Ranking Widget
- Tag Selector Widget
- Text Widget
- Top-N Analysis Widget
- VC Relationship Widget
- VC Relationship (Planning) Widget
- Define Metric Sets for a Widget
- Index

VC Relationship (Planning) Widget
The VC Relationship (Planning) widget provides use and available badge metric information (risk, time,
capacity, stress, efficiency, waste, and density) for the resources in your virtual environment. You can use
this information to plan for capacity upgrades or rebalance the workload in your virtual infrastructure.
Figure 4‑23. VC Relationship (Planning) Widget
The VC Relationship (Planning) widget uses badges to represent derived metrics and give you a high-level,
broad view of the condition of your virtual environment. Objects appear in hierarchy levels. If a badge does
not have a green status, the object has a potential problem. You can double-click a badge to see the Resource
Detail page for that object.
The toolbar at the top left of the widget contains icons that you can use to change the object display.
Table 4‑19. VC Relationship Widget Icons
Icon Description
Show Risk Values Changes the object display to show risk scores. The risk score indicates potential future
problems that might affect the performance of your system. vCenter Operations Manager
calculates the risk score based on the time remaining and stress scores.
Show Time Remaining
Values
Changes the object display to show time remaining scores. The time remaining score
indicates how much time remains before the resources of the object are exhausted.
vCenter Operations Manager calculates the score by resource type (for example, CPU use or
disk I/O) based on historical data for the pattern of use for the resource type. You can use the
time remaining score to plan provisioning of physical or virtual resources for the object or
rebalance the workload in your virtual infrastructure.
Show Capacity Values Changes the object display to show capacity scores. The capacity score indicates how close a
virtual object is to exhausting its available computing resources. Computing resources
include disk space, memory size, and network capacity.
Show Stress Values Changes the object display to show stress scores. The stress score indicates the historic
workload of the object.
Show Efficiency Values Changes the object display to show efficiency values. The efficiency score helps you identify
optimization opportunities in your system. vCenter Operations Manager calculates the
efficiency score based on the scores of the waste and density badges.
Show Waste Values Changes the object display to show waste scores. The waste score indicates over-
provisioning in your virtual infrastructure or for a specific object.
vCenter Operations Manager calculates waste for each resource type, such as CPU, memory,
and disk, for each object in the environment. You can use the waste score to identify the
amount of resources that you can reclaim and provision to other objects in your
environment.
Show Density Values Changes the object display to show density scores. The density score indicates the
consolidation ratios, such as virtual machine per host, virtual CPUs per physical CPU,
virtual memory per physical memory, and so on. You can use the density score to achieve
higher consolidation ratios and cost savings.
You can use the STATUS FILTER buttons to filter objects by state. In large inventories, filtering objects by
state can help you quickly find objects that have degraded performance characteristics.
VMware vCenter Operations Manager Getting Started Guide
108 VMware, Inc.