
5.7.1
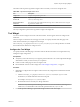
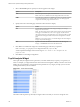
Table Of Contents
- VMware vCenter Operations Manager Getting Started Guide
- Contents
- VMware vCenter Operations Manager Getting Started Guide
- Introducing Custom User Interface Features and Concepts
- Introducing Common Tasks
- Logging In and Using vCenter Operations Manager
- Monitoring Day-to-Day Operations
- Handling Alerts
- Optimizing Your Resources
- Designing Your Workspace
- Working with Dashboards
- Create a Dashboard
- Clone a Dashboard
- Edit a Dashboard
- Delete a Dashboard
- Create a Dashboard Template
- Hide a Dashboard Tab
- Change the Order of Dashboard Tabs
- Delete a Dashboard Template
- Configure Dashboard Switching
- Share a Dashboard
- Stop Sharing a Dashboard
- Export a Dashboard
- Import a Dashboard
- vSphere Dashboards
- Working with Widgets
- Working with Dashboards
- Using and Configuring Widgets
- Edit a Widget Configuration
- Supported Widget Interactions
- Configure Widget Interactions
- Advanced Health Tree Widget
- Alerts Widget
- Application Detail Widget
- Application Overview Widget
- Configuration Overview Widget
- Custom Relationship Widget
- Data Distribution Analysis Widget
- Generic Scoreboard Widget
- GEO Widget
- Health Status Widget
- Health Tree Widget
- Health-Workload Scoreboard Widget
- Heat Map Widget
- Mashup Charts Widget
- Metric Graph Widget
- Metric Graph (Rolling View) Widget
- Metric Selector Widget
- Metric Sparklines Widget
- Metric Weather Map Widget
- Resources Widget
- Root Cause Ranking Widget
- Tag Selector Widget
- Text Widget
- Top-N Analysis Widget
- VC Relationship Widget
- VC Relationship (Planning) Widget
- Define Metric Sets for a Widget
- Index

3 Select a Filter old metrics option.
This setting is available only when you select Current Value for Period Length.
Option Description
On
Filter out metric data that is more than five collection cycles old. On is the
default value.
Off
Include data that is more than five collection cycles old. Select Off only if
you need the widget to consider less frequently collected metrics.
4 If you selected Tag mode, perform these configuration steps.
a Select an Application Health and Performance category or a Problem and Alert Analysis category
for which the widget can show information.
b Select one or more tag values in the Select which tag to show list.
You can press Ctrl+click or Shift+click to select multiple tag values. You can use icons on the
toolbar at the top of the list to collapse, expand, and deselect all of the tags in the list. When you
select more than one value for the same tag, the list includes resource kinds that have either value.
When you select values for two or more tags, the list includes only resource kinds that have all of
the values that you select.
5 If you selected Metric mode, perform these configuration steps.
a Select a Metric Analysis category for which the widget can show information.
b Select one or more tag values in the Select which tag to show pane to filter the resource kinds in the
Resource Kinds pane.
You can press Ctrl+click or Shift+click to select multiple tag values. You can use icons on the
toolbar at the top of the list to collapse, expand, and deselect all of the tags in the list. When you
select more than one value for the same tag, the list includes resource kinds that have either value.
When you select values for two or more tags, the list includes only resource kinds that have all of
the values that you select.
c Select a resource kind in the Resource Kinds pane.
The metrics for the resource kind appear in the Metrics pane.
d In the Metrics pane, select the metric to show in the widget.
You can click the Show Common Metrics icon at the top of the list to show only metrics that are
shared by all resources of the selected resource kind. You can also type all or part of a metric name
in the Search text box to search for a specific metric.
6 Click OK to save the widget configuration.
7 (Optional) To verify the filtering settings that you configured for the widget, click the Display Filtering
Criteria icon on the widget's toolbar.
The filtering settings appear in a pop-up window.
VMware vCenter Operations Manager Getting Started Guide
106 VMware, Inc.