
5.7.1
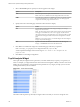
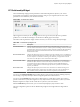
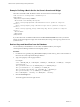
Table Of Contents
- VMware vCenter Operations Manager Getting Started Guide
- Contents
- VMware vCenter Operations Manager Getting Started Guide
- Introducing Custom User Interface Features and Concepts
- Introducing Common Tasks
- Logging In and Using vCenter Operations Manager
- Monitoring Day-to-Day Operations
- Handling Alerts
- Optimizing Your Resources
- Designing Your Workspace
- Working with Dashboards
- Create a Dashboard
- Clone a Dashboard
- Edit a Dashboard
- Delete a Dashboard
- Create a Dashboard Template
- Hide a Dashboard Tab
- Change the Order of Dashboard Tabs
- Delete a Dashboard Template
- Configure Dashboard Switching
- Share a Dashboard
- Stop Sharing a Dashboard
- Export a Dashboard
- Import a Dashboard
- vSphere Dashboards
- Working with Widgets
- Working with Dashboards
- Using and Configuring Widgets
- Edit a Widget Configuration
- Supported Widget Interactions
- Configure Widget Interactions
- Advanced Health Tree Widget
- Alerts Widget
- Application Detail Widget
- Application Overview Widget
- Configuration Overview Widget
- Custom Relationship Widget
- Data Distribution Analysis Widget
- Generic Scoreboard Widget
- GEO Widget
- Health Status Widget
- Health Tree Widget
- Health-Workload Scoreboard Widget
- Heat Map Widget
- Mashup Charts Widget
- Metric Graph Widget
- Metric Graph (Rolling View) Widget
- Metric Selector Widget
- Metric Sparklines Widget
- Metric Weather Map Widget
- Resources Widget
- Root Cause Ranking Widget
- Tag Selector Widget
- Text Widget
- Top-N Analysis Widget
- VC Relationship Widget
- VC Relationship (Planning) Widget
- Define Metric Sets for a Widget
- Index

Root Cause Ranking Widget
The Root Cause Ranking widget provides an instant view of the probable causes of health degradation for a
selected resource. The widget shows information about metrics on related resources that contributed to
alerts on the resources, including the percentage likelihood that the metric contributed to the cause.
vCenter Operations Manager bases the percentage likelihood on the number of symptoms and when the
symptoms occurred relative to the alert.
Figure 4‑20. Root Cause Ranking Widget
You can view root causes in Symptom mode and Resource mode.
Symptom mode
Shows root cause information based on anomalies that occurred during the
previous six hours, unless a providing widget passes a different time period.
You can double-click a resource to see the symptom groups ranked by
percentage of possible resources that exhibit symptoms in the group. You
can double-click a group to see the top five individual symptoms ranked by
percentage of possible resources that exhibit the symptom. You can double-
click a symptom, or select it and click Show Bar Details, to open a pop-up
window that shows detailed information about the symptom. This is the
default mode.
Resource mode
Shows root cause information based on anomalies that occurred during the
previous two hours. If a providing widget passes a different time period, it
shows information for all anomalies active in that time period. Double-click a
resource, or select it and click Show Bar Details, to list the individual
anomalies.
A change event symptom might include different types of events that have different messages. If all of the
change events for a symptom are the same type, the message appears to the right of the symptom bar. If the
message does not fit, you can point to the message to the see the full message. If the symptom includes
different messages, Multiple Change Events appears.
NOTE If the Health Status widget provides resources to the Root Cause Ranking widget and you click at a
point in the past on the health score graph for a resource, the Root Cause Ranking widget shows root causes
for the time that you selected.
The toolbar at the top of the Root Cause Ranking widget contains icons that you can use to view the graph.
Chapter 4 Using and Configuring Widgets
VMware, Inc. 101