
5.0


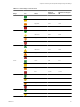
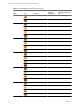
Table Of Contents
- VMware vCenter Operations Manager Advanced Getting Started Guide
- Contents
- VMware vCenter Operations Manager Advanced Getting Started Guide
- vCenter Operations Manager Features
- Preparing to Monitor a vCenter Operations Manager Virtual Environment
- Object Type Icons in the Inventory Pane
- Badge Concepts for vCenter Operations Manager Planning
- Major Badges in vCenter Operations Manager
- Working with Metrics and Charts on the All Metrics Tab
- Planning the vCenter Operations Manager Workflow
- Monitoring Day-to-Day Activity in vCenter Operations Manager
- Identify an Overall Health Issue
- Determine the Timeframe and Nature of a Health Issue
- Determine Whether the Environment Operates as Expected
- Identify the Source of Performance Degradation
- Identify Events that Occurred when an Object Experienced Performance Degradation
- Identify the Top Resource Consumers
- Determine the Extent of a Performance Degradation
- Determine When an Object Might Run Out of Resources
- Determine the Cause of a Problem with a Specific Object
- Address a Problem with a Specific Virtual Machine
- Address a Problem with a Specific Datastore
- Identify Objects with Stressed Capacity
- Identify Stressed Objects with vCenter Operations Manager
- Identify the Underlying Memory Resource Problem for Clusters and Hosts
- Identify the Underlying Memory Resource Problem for a Virtual Machine
- Determine the Percentage of Used and Remaining Capacity to Assess Current Needs
- Preparing Proactive Workflows in vCenter Operations Manager
- Planning and Analyzing Data for Capacity Risk
- Identify Clusters with the Space for Virtual Machines
- Identify the Source of Performance Degradation Through Heat Maps
- Identify Datastores with Space for Virtual Machines
- Identify Datastores with Wasted Space
- Identify the Virtual Machines with Resource Waste Across Datastores
- Identify the Host and Datastore with the Highest Latency
- Optimizing Data for Capacity
- Determine How Efficiently You Use the Virtual Infrastructure
- Identify the Consolidation Ratio Trend for a Datacenter or Cluster
- Determine Reclaimable Resources from Underused Objects
- Assess Virtual Machine Capacity Use
- Assess Virtual Machine Optimization Data
- Identify Powered-Off Virtual Machines to Optimize Data
- Identify Idle Virtual Machines to Optimize Capacity
- Identify Oversized Virtual Machines to Optimize Data
- Determine the Trend of Waste for a Virtual Machine
- Forecasting Data for Capacity Risk
- Create Capacity Scenarios for Virtual Machines With New Profiles
- Create Capacity Scenarios for Virtual Machines With Existing Profiles
- Create a Hardware Change Scenario
- Create a What-If Scenario to Remove Virtual Machines
- Combine the Results of What-If Scenarios
- Compare the Results of What-If Scenarios
- Delete a Scenario from the What-If Scenarios List
- Planning and Analyzing Data for Capacity Risk
- Planning vCenter Operations Manager Workflow with Alerts
- Customizing vCenter Operations Manager Configuration Settings
- Index

3 In the Alerts list, filter the alerts by columns or select an alert icon.
Option Action
To view the most critical alerts that
need immediate attention.
Select the Criticality column.
To filter badge alerts in the object.
Select the Type column.
To filter sub-badge alerts in the
object.
Select the Sub-Type column.
To view the most recent alerts in the
object.
Select the Start Time column.
To filter the duration of the alert to
identify the alerts that the
administrator has not attended to.
Select the Duration column.
To view the Administrative alerts in
the object.
Select the Administrative Alert icon.
To view the System alerts in the
object.
Select the System icon.
To view the Environment alerts in the
object.
Select the Environment icon.
What to do next
To investigate the possible causes of an alert, double-click the alert for details.
Identify Capacity Related Alerts
Capacity related alerts might be triggered because of resources running out of capacity, stressed virtual
machines, or resources wasting memory.
Prerequisites
Verify that you are logged in to a vSphere Client and that vCenter Operations Manager is open.
Procedure
1 In the inventory pane, select the object that you want to inspect.
2 Click the Alerts tab to view a list of active alerts.
3 In the Alerts list, filter the list by the Capacity Remaining badge to view alerts that address capacity.
When you double-click an alert, vCenter Operations Manager opens a pop-up window displaying the
alert details.
What to do next
To find aggregate information for used and total capacity and capacity trends, click the Views tab under the
Planning tab and select the Capacity badge.
Identify the Overall Trend of Alert Types
You can use the overall trend of alert types to identify the number of critical alerts over a period of time.
Prerequisites
Verify that you are logged in to a vSphere Client and that vCenter Operations Manager is open.
Procedure
1 In the inventory pane, select the object that you want to inspect.
Chapter 5 Planning vCenter Operations Manager Workflow with Alerts
VMware, Inc. 51