
5.0
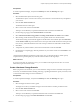

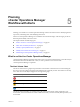
Table Of Contents
- VMware vCenter Operations Manager Advanced Getting Started Guide
- Contents
- VMware vCenter Operations Manager Advanced Getting Started Guide
- vCenter Operations Manager Features
- Preparing to Monitor a vCenter Operations Manager Virtual Environment
- Object Type Icons in the Inventory Pane
- Badge Concepts for vCenter Operations Manager Planning
- Major Badges in vCenter Operations Manager
- Working with Metrics and Charts on the All Metrics Tab
- Planning the vCenter Operations Manager Workflow
- Monitoring Day-to-Day Activity in vCenter Operations Manager
- Identify an Overall Health Issue
- Determine the Timeframe and Nature of a Health Issue
- Determine Whether the Environment Operates as Expected
- Identify the Source of Performance Degradation
- Identify Events that Occurred when an Object Experienced Performance Degradation
- Identify the Top Resource Consumers
- Determine the Extent of a Performance Degradation
- Determine When an Object Might Run Out of Resources
- Determine the Cause of a Problem with a Specific Object
- Address a Problem with a Specific Virtual Machine
- Address a Problem with a Specific Datastore
- Identify Objects with Stressed Capacity
- Identify Stressed Objects with vCenter Operations Manager
- Identify the Underlying Memory Resource Problem for Clusters and Hosts
- Identify the Underlying Memory Resource Problem for a Virtual Machine
- Determine the Percentage of Used and Remaining Capacity to Assess Current Needs
- Preparing Proactive Workflows in vCenter Operations Manager
- Planning and Analyzing Data for Capacity Risk
- Identify Clusters with the Space for Virtual Machines
- Identify the Source of Performance Degradation Through Heat Maps
- Identify Datastores with Space for Virtual Machines
- Identify Datastores with Wasted Space
- Identify the Virtual Machines with Resource Waste Across Datastores
- Identify the Host and Datastore with the Highest Latency
- Optimizing Data for Capacity
- Determine How Efficiently You Use the Virtual Infrastructure
- Identify the Consolidation Ratio Trend for a Datacenter or Cluster
- Determine Reclaimable Resources from Underused Objects
- Assess Virtual Machine Capacity Use
- Assess Virtual Machine Optimization Data
- Identify Powered-Off Virtual Machines to Optimize Data
- Identify Idle Virtual Machines to Optimize Capacity
- Identify Oversized Virtual Machines to Optimize Data
- Determine the Trend of Waste for a Virtual Machine
- Forecasting Data for Capacity Risk
- Create Capacity Scenarios for Virtual Machines With New Profiles
- Create Capacity Scenarios for Virtual Machines With Existing Profiles
- Create a Hardware Change Scenario
- Create a What-If Scenario to Remove Virtual Machines
- Combine the Results of What-If Scenarios
- Compare the Results of What-If Scenarios
- Delete a Scenario from the What-If Scenarios List
- Planning and Analyzing Data for Capacity Risk
- Planning vCenter Operations Manager Workflow with Alerts
- Customizing vCenter Operations Manager Configuration Settings
- Index

Planning
vCenter Operations Manager
Workflow with Alerts 5
Planning your workflow in a vCenter Operations Manager virtual environment involves identifying alerts to
respond to, maintaining alerts, and identifying alert trends.
Alerts in vCenter Operations Manager are available for all of the minor badges. Alert messages provide an
alternate path to identify and resolve issues.
This chapter includes the following topics:
n
“What Is an Alert in vCenter Operations Manager,” on page 49
n
“Filter Alerts to Identify Notifications,” on page 50
n
“Identify Capacity Related Alerts,” on page 51
n
“Identify the Overall Trend of Alert Types,” on page 51
n
“Maintaining vCenter Operations Manager Alerts,” on page 52
What Is an Alert in vCenter Operations Manager
vCenter Operations Manager generates alerts when events occur on the monitored objects, when data analysis
indicates deviations from normal metric values, or when a problem occurs with one of the
vCenter Operations Manager components.
The Alert Volume Chart
The Alert Volume chart is a graphical representation of the number of alerts that were activated during the
last 7 days. The color coding in the graph represents the level of criticality of alerts. The number of currently
active alerts of each criticality level appears to the right of the graph.
Alert Icon Description
Critical alert. You must act immediately.
Immediate alert. Act as soon as possible.
Warning alert. Check the condition of the selected object.
Information alert.
The Alert Volume chart helps you visually assess what is the overall volume of alerts triggered in your
environment, what is the ratio between alerts of different criticality, and what criticality level prevails in your
environment.
VMware, Inc.
49