
5.0
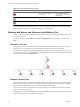
Table Of Contents
- VMware vCenter Operations Manager Advanced Getting Started Guide
- Contents
- VMware vCenter Operations Manager Advanced Getting Started Guide
- vCenter Operations Manager Features
- Preparing to Monitor a vCenter Operations Manager Virtual Environment
- Object Type Icons in the Inventory Pane
- Badge Concepts for vCenter Operations Manager Planning
- Major Badges in vCenter Operations Manager
- Working with Metrics and Charts on the All Metrics Tab
- Planning the vCenter Operations Manager Workflow
- Monitoring Day-to-Day Activity in vCenter Operations Manager
- Identify an Overall Health Issue
- Determine the Timeframe and Nature of a Health Issue
- Determine Whether the Environment Operates as Expected
- Identify the Source of Performance Degradation
- Identify Events that Occurred when an Object Experienced Performance Degradation
- Identify the Top Resource Consumers
- Determine the Extent of a Performance Degradation
- Determine When an Object Might Run Out of Resources
- Determine the Cause of a Problem with a Specific Object
- Address a Problem with a Specific Virtual Machine
- Address a Problem with a Specific Datastore
- Identify Objects with Stressed Capacity
- Identify Stressed Objects with vCenter Operations Manager
- Identify the Underlying Memory Resource Problem for Clusters and Hosts
- Identify the Underlying Memory Resource Problem for a Virtual Machine
- Determine the Percentage of Used and Remaining Capacity to Assess Current Needs
- Preparing Proactive Workflows in vCenter Operations Manager
- Planning and Analyzing Data for Capacity Risk
- Identify Clusters with the Space for Virtual Machines
- Identify the Source of Performance Degradation Through Heat Maps
- Identify Datastores with Space for Virtual Machines
- Identify Datastores with Wasted Space
- Identify the Virtual Machines with Resource Waste Across Datastores
- Identify the Host and Datastore with the Highest Latency
- Optimizing Data for Capacity
- Determine How Efficiently You Use the Virtual Infrastructure
- Identify the Consolidation Ratio Trend for a Datacenter or Cluster
- Determine Reclaimable Resources from Underused Objects
- Assess Virtual Machine Capacity Use
- Assess Virtual Machine Optimization Data
- Identify Powered-Off Virtual Machines to Optimize Data
- Identify Idle Virtual Machines to Optimize Capacity
- Identify Oversized Virtual Machines to Optimize Data
- Determine the Trend of Waste for a Virtual Machine
- Forecasting Data for Capacity Risk
- Create Capacity Scenarios for Virtual Machines With New Profiles
- Create Capacity Scenarios for Virtual Machines With Existing Profiles
- Create a Hardware Change Scenario
- Create a What-If Scenario to Remove Virtual Machines
- Combine the Results of What-If Scenarios
- Compare the Results of What-If Scenarios
- Delete a Scenario from the What-If Scenarios List
- Planning and Analyzing Data for Capacity Risk
- Planning vCenter Operations Manager Workflow with Alerts
- Customizing vCenter Operations Manager Configuration Settings
- Index

Table 2-12. Object Density States (Continued)
Badge Icon Description User Action
The resource consolidation is
extremely low.
Select Planning > Views to
identify resource consolidation
opportunities.
No data is available for any of
the metrics for the time period.
The object is offline.
A vCenter Operations Manager administrator can change the badge score thresholds. For example, a green
Density badge can indicate a score above 40 instead of 25, as set by default.
Working with Metrics and Charts on the All Metrics Tab
You can check the location of an object in the hierarchy and select metrics to view graphs of their historic values
for a period you define.
You can use the panes on the All Metrics tab under the Operations tab to search metrics and view metric
graphs.
The Health Tree Pane
The Health Tree pane displays the location of the currently selected object in the hierarchy of your virtual
infrastructure. You can check all parent and child objects related to the currently selected object.
For example, the sample hierarchy shows the parent and child objects in the virtual infrastructure. The red
icon indicates a presence of a potential problem in the vCenter Server object. You can investigate the probable
cause of the problem from the Dashboard tab.
The Metric Selector Pane
The Metric Selector pane contains a list of all metric groups that are applicable to the currently selected object.
Metric groups contain all the metrics that are applicable to the currently selected object. The list of available
metrics is updated depending on the object you selected in the Health Tree pane.
The Search text box allows you find metrics using part of their names and filter the search results by metric
groups, instances or metric types.
For example, if you type % in the Search text box and select Metric from the drop-down menu, the search result
contains only metrics that are calculated as percentage.
VMware vCenter Operations Manager Advanced Getting Started Guide
20 VMware, Inc.