
5.0
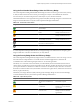
Table Of Contents
- VMware vCenter Operations Manager Advanced Getting Started Guide
- Contents
- VMware vCenter Operations Manager Advanced Getting Started Guide
- vCenter Operations Manager Features
- Preparing to Monitor a vCenter Operations Manager Virtual Environment
- Object Type Icons in the Inventory Pane
- Badge Concepts for vCenter Operations Manager Planning
- Major Badges in vCenter Operations Manager
- Working with Metrics and Charts on the All Metrics Tab
- Planning the vCenter Operations Manager Workflow
- Monitoring Day-to-Day Activity in vCenter Operations Manager
- Identify an Overall Health Issue
- Determine the Timeframe and Nature of a Health Issue
- Determine Whether the Environment Operates as Expected
- Identify the Source of Performance Degradation
- Identify Events that Occurred when an Object Experienced Performance Degradation
- Identify the Top Resource Consumers
- Determine the Extent of a Performance Degradation
- Determine When an Object Might Run Out of Resources
- Determine the Cause of a Problem with a Specific Object
- Address a Problem with a Specific Virtual Machine
- Address a Problem with a Specific Datastore
- Identify Objects with Stressed Capacity
- Identify Stressed Objects with vCenter Operations Manager
- Identify the Underlying Memory Resource Problem for Clusters and Hosts
- Identify the Underlying Memory Resource Problem for a Virtual Machine
- Determine the Percentage of Used and Remaining Capacity to Assess Current Needs
- Preparing Proactive Workflows in vCenter Operations Manager
- Planning and Analyzing Data for Capacity Risk
- Identify Clusters with the Space for Virtual Machines
- Identify the Source of Performance Degradation Through Heat Maps
- Identify Datastores with Space for Virtual Machines
- Identify Datastores with Wasted Space
- Identify the Virtual Machines with Resource Waste Across Datastores
- Identify the Host and Datastore with the Highest Latency
- Optimizing Data for Capacity
- Determine How Efficiently You Use the Virtual Infrastructure
- Identify the Consolidation Ratio Trend for a Datacenter or Cluster
- Determine Reclaimable Resources from Underused Objects
- Assess Virtual Machine Capacity Use
- Assess Virtual Machine Optimization Data
- Identify Powered-Off Virtual Machines to Optimize Data
- Identify Idle Virtual Machines to Optimize Capacity
- Identify Oversized Virtual Machines to Optimize Data
- Determine the Trend of Waste for a Virtual Machine
- Forecasting Data for Capacity Risk
- Create Capacity Scenarios for Virtual Machines With New Profiles
- Create Capacity Scenarios for Virtual Machines With Existing Profiles
- Create a Hardware Change Scenario
- Create a What-If Scenario to Remove Virtual Machines
- Combine the Results of What-If Scenarios
- Compare the Results of What-If Scenarios
- Delete a Scenario from the What-If Scenarios List
- Planning and Analyzing Data for Capacity Risk
- Planning vCenter Operations Manager Workflow with Alerts
- Customizing vCenter Operations Manager Configuration Settings
- Index

Using the Anomalies Badge Under the Health Badge
The vCenter Operations Manager Anomalies badge measures the extent of abnormal behavior for an object
based on historical metrics data. A high number of anomalies might indicate a potential issue.
A low Anomalies score indicates that an object is behaving in accordance with its established historical
parameters. Most or all of the object metrics, especially its KPIs, are within their thresholds. Because changes
in behavior often indicate developing problems, if the metrics of an object go outside the calculated thresholds,
the anomalies score for the object grows. As more metrics breach the thresholds, anomalies continue to increase.
Violations by KPI metrics increase the Anomalies score more than violations by non-KPI metrics. A high
number of anomalies usually indicates a problem or at least a situation that requires your attention.
Anomalies involves the number of statistics that fall outside of the expected behavior trends while Workload
involves an absolute measurement of how hard an object works for resources. Both Anomalies and Workload
are useful when attempting to find a probable cause and troubleshooting performance problems.
The Anomalies score ranges between 0 (good) and 100 (bad). The badge changes its color based on the badge
score thresholds that are set by the vCenter Operations Manager administrator.
Table 2-4. Object Anomalies States
Badge Icon Description User Action
The Anomalies score is normal. No attention required.
The Anomalies score exceeds the
normal range.
Check and take appropriate
action.
The Anomalies score is very
high.
Check and take appropriate
action as soon as possible.
Most of the metrics are beyond
their thresholds. This object
might not be working properly
or will stop working soon.
Act immediately to avoid or
correct problems.
No data is available for any of
the metrics for the time period.
The object is offline.
A vCenter Operations Manager administrator can change the badge score thresholds. For example, a green
Anomalies badge can indicate a score below 60 instead of 50, as set be default.
Using the Faults Badge Under the Health Badge
The vCenter Operations Manager Faults badge measure the degree of problems that the object might
experience based on events retrieved from the vCenter Server.
The events that might generate faults include the loss of redundancy in NICs or HBAs, memory checksum
errors, high availability failover, or Common Information Model (CIM) events, which require your immediate
attention.
The Faults score ranges between 0 (no faults) and 100 (critical faults). The badge changes its color based on the
badge score thresholds that are set by the vCenter Operations Manager administrator.
VMware vCenter Operations Manager Advanced Getting Started Guide
14 VMware, Inc.