
5.8.5
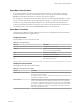
Table Of Contents
- VMware vCenter Operations Manager Administration Guide
- Contents
- VMware vCenter Operations Manager Administration Guide
- Configuring and Managing vCenter Operations Manager
- Configuring Adapters
- Configuring Resources
- Configuring Attribute Packages
- Configuring Applications
- Configuring and Managing Users
- Configuring Alert Notifications
- Performing Basic System Administration Tasks
- View Performance Information
- View Status Information
- vCenter Operations Manager Service Names
- Start or Stop vCenter Operations Manager Services
- Viewing and Managing System Log Files
- Delete Old Data in the File System Database
- Run the Audit Report
- Modify Global Settings
- Modify Global Settings for Virtual Environments
- Create a Support Bundle
- Resolving Administrative System Alerts
- Analytics FSDB Overloaded
- Analytics Threshold Checking Overloaded
- Collector Is Down
- Controller Is Unable to Connect to MQ
- DataQueue Is Filling Up
- Describe Failed
- Failed to Connect to Replication MQ
- Failed to Repair Corrupted FSDB Files
- File Queue Is Full
- FSDB Files Corrupted for Resources
- FSDB Storage Drive Free Space Is Less Than 10%
- No DT Processors Connected
- One or More Resources Were Not Started
- Outbound Alert Send Failed
- Replication MQ Sender Is Blocked
- Backing Up and Recovering Data
- Backing Up and Recovering Data Components
- Backing Up and Recovering Processing Components
- Configuring the Repository Adapter
- Repository Adapter Requirements and Limitations
- Repository Adapter Configuration Steps
- Creating a Database User for the Repository Adapter
- Configure the Source Database Connection for the Repository Adapter
- Configure the Output Destination for the Repository Adapter
- Configuring the Source and Destination Columns for the Repository Adapter
- Configure Data Export Values for the Repository Adapter
- Customizing Repository Adapter Operation
- Start the Repository Adapter
- Using System Tools
- Using the Database Command Line Interface
- Index

Except for Self - Total, any metric that vCenter Operations Manager generates that begins with Self
includes data only for the resource. Metrics that begin with Full Set include data for all of the resource's
children, but do not include the resource itself.
Table 4‑1. vCenter Operations Generated Attribute Package Metrics
Name Description
Self - Health Score Health score of the resource.
Self - Metric Count Number of metrics defined for the resource.
Self - KPI Count Number of KPI defined for the resource.
Self - Active Anomaly Count Number of currently active anomalies for the resource.
Self - New Anomaly Count Number of new anomalies for the resource. An anomaly is
new if it occurred for the first time in the most recent
collection cycle.
Self - Active KPI Breach Count Number of KPIs for the resource which are currently
violating their thresholds.
Self - New KPI Breach Count Number of KPIs for the resource with new threshold
violations. A breach is new if it occurred for the first time
in the most recent collection cycle.
Full Set - Metric Count Number of metrics defined for the resource’s children.
Full Set - KPI Count Number of KPI defined for the resource’s children.
Full Set - Anomaly Count Number of currently active anomalies for the resource’s
children.
Full Set - New Anomaly Count Number of new anomalies for the resource’s children. An
anomaly is new if it occurred for the first time in the most
recent collection cycle.
Full Set - Active KPI Breach Count Number of KPIs for the resource’s children which are
currently violating their thresholds.
Full Set - New KPI Breach Count Number of KPIs for the resource’s children with new
threshold violations. A breach is new if it occurred for the
first time in the most recent collection cycle.
Self - Total Anomalies Total number of active anomalies for the resource and all
its children. This is the only vCenter Operations Manager
generated metric that includes the resource itself and its
children. If you display the metric graph for this attribute,
it includes the calculated noise line for the resource, which
is the number of anomalies that triggers an early warning
alert.
Availability Can be one of the following values.
n
1 (data is being received properly)
n
0 (resource is unavailable)
n
-1 (adapter resource is not receiving data for this
resource)
Chapter 4 Configuring Attribute Packages
VMware, Inc. 41