
5.8.5
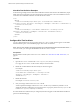
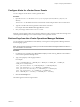

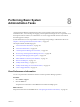
Table Of Contents
- VMware vCenter Operations Manager Administration Guide
- Contents
- VMware vCenter Operations Manager Administration Guide
- Configuring and Managing vCenter Operations Manager
- Configuring Adapters
- Configuring Resources
- Configuring Attribute Packages
- Configuring Applications
- Configuring and Managing Users
- Configuring Alert Notifications
- Performing Basic System Administration Tasks
- View Performance Information
- View Status Information
- vCenter Operations Manager Service Names
- Start or Stop vCenter Operations Manager Services
- Viewing and Managing System Log Files
- Delete Old Data in the File System Database
- Run the Audit Report
- Modify Global Settings
- Modify Global Settings for Virtual Environments
- Create a Support Bundle
- Resolving Administrative System Alerts
- Analytics FSDB Overloaded
- Analytics Threshold Checking Overloaded
- Collector Is Down
- Controller Is Unable to Connect to MQ
- DataQueue Is Filling Up
- Describe Failed
- Failed to Connect to Replication MQ
- Failed to Repair Corrupted FSDB Files
- File Queue Is Full
- FSDB Files Corrupted for Resources
- FSDB Storage Drive Free Space Is Less Than 10%
- No DT Processors Connected
- One or More Resources Were Not Started
- Outbound Alert Send Failed
- Replication MQ Sender Is Blocked
- Backing Up and Recovering Data
- Backing Up and Recovering Data Components
- Backing Up and Recovering Processing Components
- Configuring the Repository Adapter
- Repository Adapter Requirements and Limitations
- Repository Adapter Configuration Steps
- Creating a Database User for the Repository Adapter
- Configure the Source Database Connection for the Repository Adapter
- Configure the Output Destination for the Repository Adapter
- Configuring the Source and Destination Columns for the Repository Adapter
- Configure Data Export Values for the Repository Adapter
- Customizing Repository Adapter Operation
- Start the Repository Adapter
- Using System Tools
- Using the Database Command Line Interface
- Index
Interpreting Performance Information
vCenter Operations Manager provides performance information related to its own operation. Performance
information is divided into multiple panes on the Status tab.
Health Status
Shows the health graph and the current health score. To see the exact health score from a time on the graph,
point to that time. You can point to the More icon to see its collector and other information.
Root Cause Ranking
Shows the root causes of any current health degradation. Double-click a symptom group to list specific
resources that show that symptom. You can also double-click a specific symptom resource to open a pop-up
window that shows details about the specific threshold violations.
Metric Selector
Shows the metric groups that are selected in the Health Tree pane. Expand a metric group to see the
individual metrics. To see a graph for a metric in the Metric Graphs pane, double-click it or select it and click
the Move to Graph icon.
Health Tree
Shows the section of the health tree around vCenter Operations Manager. You can select a resource to list its
metrics, select a resource and click the Show Detail icon to show the Resource Detail page, or select a
resource and click the Show Alerts icon to list current alerts.
Metric Graph
Shows graphs for the selected metrics.
View Status Information
You can view status information for vCenter Operations Manager collectors, adapters, and dynamic
threshold calculations. Dynamic threshold calculations are part of vCenter Operations Manager analytics.
Procedure
1 Select Admin > Support.
2 Click the Info tab.
The status information on the Info tab is divided into multiple panes.
Interpret the information on the Info tab. See “Interpreting Status Information,” on page 106.
Interpreting Status Information
vCenter Operations Manager reports status information for collectors, adapters, and dynamic threshold
calculations. Status information is divided into multiple panes on the Info tab.
Describe Info
Shows the status of the describe process, which sends information about the data that can be collected from
each adapter to the vCenter Operations Manager server. The describe status for individual adapters appears
in the Adapter Info pane.
VMware vCenter Operations Manager Administration Guide
106 VMware, Inc.