
5.0
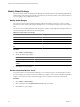
Table Of Contents
- VMware vCenter Operations Manager Enterprise Administration Guide
- Contents
- VMware vCenter Operations Manager Enterprise Administration Guide
- Configuring and Managing vCenter Operations Manager
- Configuring Adapters
- Configuring Resources
- Configuring Attribute Packages
- Configuring Applications
- Configuring and Managing Users
- Configuring Alert Notifications
- Performing Basic System Administration Tasks
- View vCenter Operations Manager Performance Information
- View vCenter Operations Manager Status Information
- Start or StopvCenter Operations Manager Services
- Viewing and Managing System Log Files
- Delete Old Data in the File System Database
- Run the Audit Report
- Modify Global Settings
- Modify Global Settings for Virtual Environments
- Create a Support Bundle
- Resolving Administrative System Alerts
- Analytics FSDB Overloaded
- Analytics Threshold Checking Overloaded
- Collector Is Down
- Controller Is Unable to Connect to MQ
- DataQueue Is Filling Up
- Describe Failed
- Failed to Repair Corrupted FSDB Files
- File Queue Is Full
- FSDB Files Corrupted for Resources
- FSDB Storage Drive Free Space Is Less Than 10%
- No DT Processors Connected
- One or More Resources Were Not Started
- Outbound Alert Send Failed
- Replication MQ Sender Is Blocked
- Backing Up and Recovering Data
- Using System Tools
- Summary of vCenter Operations Manager System Tools
- Check the FSDB and Repair Problems
- Move the FSDB
- View Resources in the FSDB
- Remove System-Generated Metrics from the FSDB
- Monitor vCenter Operations Manager Services in JConsole
- Verify Server to Collector Communication
- Configuring and Running the Repository Adapter
- Configure Database Connections for the Repository Adapter
- Set the Repository Adapter Schedule
- Configure the Source and Destination Columns for the Repository Adapter
- Set Operation Options for the Repository Adapter
- Configure Data Export Values for the Repository Adapter
- Start the Repository Adapter
- conf.properties File
- Configuring and Running runvcopsServerConfiguration
- Using the FSDB JDBC Driver
- Index

Modify Global Settings
You can customize certain vCenter Operations Manager user interface behaviors by modifying global settings.
Global settings control the ranges for health color indicators, the interaction metrics count, and the number of
root cause groups. These settings affect all users.
Modify Health Ranges
One of the ways that vCenter Operations Manager indicates the health of a resource is to show a colored
indicator. The color is based on the range of the health score. You can change the range for all colors except for
blue.
You can also choose whether the health chart that appears on many vCenter Operations Manager windows is
colored according to the health score for each time period.
Table 8-3. Default Health Color Ranges
Color Range
Green 76 to 100
Yellow 51 to 75
Orange 26 to 50
Red 1 to 25
Blue 0
Procedure
1 Select Admin > Global Settings.
2 Modify the health range settings.
Option Action
Change the range for a color
Type different values in the From and To text boxes.
Change whether the health chart is
colored
Select or deselect the Health Chart Colored check box.
3 Click OK to save your changes.
Set the Interaction Metrics Count
In several locations in vCenter Operations Manager, you can select an object to see related items of another
type. For example, you can click a resource in the Resources widget to see its metrics in the Metric Sparklines
widget. You can select how many related items appear when you perform an interaction of this kind.
Procedure
1 Select Admin > Global Settings.
2 Select a number from the Important Metrics Count drop-down menu.
3 Click OK to save your changes.
VMware vCenter Operations Manager Enterprise Administration Guide
98 VMware, Inc.