
5.8.5
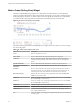
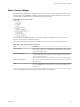
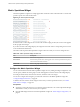
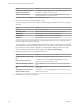
Table Of Contents
- VMware vCenter Operations Manager Getting Started Guide
- Contents
- VMware vCenter Operations Manager Getting Started Guide
- Introducing Custom User Interface Features and Concepts
- Introducing Common Tasks
- Logging In and Using vCenter Operations Manager
- Monitoring Day-to-Day Operations
- Handling Alerts
- Optimizing Your Resources
- Designing Your Workspace
- Working with Dashboards
- Create a Dashboard
- Clone a Dashboard
- Edit a Dashboard
- Delete a Dashboard
- Create a Dashboard Template
- Hide a Dashboard Tab
- Change the Order of Dashboard Tabs
- Delete a Dashboard Template
- Configure Dashboard Switching
- Share a Dashboard
- Stop Sharing a Dashboard for all Users
- Stop Sharing a Dashboard for a Group
- Export a Dashboard
- Import a Dashboard
- vSphere Dashboards
- Working with Widgets
- Working with Dashboards
- Using and Configuring Widgets
- Edit a Widget Configuration
- Supported Widget Interactions
- Configure Widget Interactions
- Advanced Health Tree Widget
- Alerts Widget
- Application Detail Widget
- Application Overview Widget
- Configuration Overview Widget
- Custom Relationship Widget
- Data Collection Results Widget
- Data Distribution Analysis Widget
- Generic Scoreboard Widget
- GEO Widget
- Health Status Widget
- Health Tree Widget
- Health-Workload Scoreboard Widget
- Heat Map Widget
- Mashup Charts Widget
- Metric Graph Widget
- Metric Graph (Rolling View) Widget
- Metric Selector Widget
- Metric Sparklines Widget
- Metric Weather Map Widget
- Resources Widget
- Root Cause Ranking Widget
- Tag Selector Widget
- Text Widget
- Top-N Analysis Widget
- VC Relationship Widget
- VC Relationship (Planning) Widget
- Define Metric Sets for a Widget
- Index

Metric Sparklines Widget
The Metric Sparklines widget shows simple graphs that contain the values of selected metrics over time and
provides a quick view of the trends in KPIs.
Figure 4‑16. Metric Sparklines Widget
If all of the metrics in the widget are for a resource that another widget provides, the resource name appears
at the top right of the widget.
If you select a metric in the widget display, the widget uses the metric and its corresponding resource as the
source for dashboard interactions.
The toolbar at the top of the Metric Sparklines widget contains icons that you can use to change the view.
Table 4‑12. Metric Sparklines Widget Toolbar Icons
Icon Description
Auto Refresh Refreshes the widget data.
Date Controls Select the time period to show on the graphs. You can select a period in the top box, or
select start and end dates and times.
Remove All Removes all graphs from the widget.
Configure the Metric Sparklines Widget
You can select the metrics that the Metric Sparklines widget shows by editing the widget configuration. You
can also specify whether the metric graph or metric label appears in the first column of the widget display
and configure metric labels, metric units of measure, and metric value color ranges.
You can also configure other widgets to provide metric selections to the Metric Sparklines widget. See
“Configure Widget Interactions,” on page 63.
To define a fixed set of metrics for the widget to draw when you select a particular resource, see “Define
Metric Sets for a Widget,” on page 113.
Prerequisites
n
Verify that you have the necessary access rights to perform this task. Your vCenter Operations Manager
administrator can tell you which actions you can perform.
n
Open the Edit Widget window for the Metric Sparklines widget. See “Edit a Widget Configuration,” on
page 56.
VMware vCenter Operations Manager Getting Started Guide
98 VMware, Inc.