
5.8.5
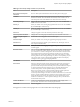
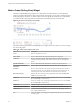
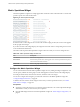
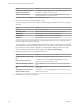
Table Of Contents
- VMware vCenter Operations Manager Getting Started Guide
- Contents
- VMware vCenter Operations Manager Getting Started Guide
- Introducing Custom User Interface Features and Concepts
- Introducing Common Tasks
- Logging In and Using vCenter Operations Manager
- Monitoring Day-to-Day Operations
- Handling Alerts
- Optimizing Your Resources
- Designing Your Workspace
- Working with Dashboards
- Create a Dashboard
- Clone a Dashboard
- Edit a Dashboard
- Delete a Dashboard
- Create a Dashboard Template
- Hide a Dashboard Tab
- Change the Order of Dashboard Tabs
- Delete a Dashboard Template
- Configure Dashboard Switching
- Share a Dashboard
- Stop Sharing a Dashboard for all Users
- Stop Sharing a Dashboard for a Group
- Export a Dashboard
- Import a Dashboard
- vSphere Dashboards
- Working with Widgets
- Working with Dashboards
- Using and Configuring Widgets
- Edit a Widget Configuration
- Supported Widget Interactions
- Configure Widget Interactions
- Advanced Health Tree Widget
- Alerts Widget
- Application Detail Widget
- Application Overview Widget
- Configuration Overview Widget
- Custom Relationship Widget
- Data Collection Results Widget
- Data Distribution Analysis Widget
- Generic Scoreboard Widget
- GEO Widget
- Health Status Widget
- Health Tree Widget
- Health-Workload Scoreboard Widget
- Heat Map Widget
- Mashup Charts Widget
- Metric Graph Widget
- Metric Graph (Rolling View) Widget
- Metric Selector Widget
- Metric Sparklines Widget
- Metric Weather Map Widget
- Resources Widget
- Root Cause Ranking Widget
- Tag Selector Widget
- Text Widget
- Top-N Analysis Widget
- VC Relationship Widget
- VC Relationship (Planning) Widget
- Define Metric Sets for a Widget
- Index

Metric Selector Widget
The Metric Selector widget shows attribute packages for one or more resources that you select in the Alerts,
Generic Scoreboard, Health Status, Health Tree, Health-Workload Scoreboard, Heat Map, Resources, Root
Cause Ranking, VC Relationship, or VC Relationship (Planning) widget.
Figure 4‑15. Metric Selector Widget
You can expand each attribute group to view its metrics. When the widget shows metrics for only one
resource, metrics that have anomalies are yellow.
The toolbar at the top of the Metric Selector widget contains icons that you can use to change the view.
Table 4‑11. Metric Selector Widget Toolbar Icons
Icon Description
Move To Graph Select one or more metrics and click this icon to make the metrics appear in the
Metric Graph widget. You can also double-click any attribute to make it appear
in the Metric Graph widget.
Show Common Metrics If you selected multiple metrics in the providing widget, click this icon to show
only those metrics that are common to all resources. Click the icon again to list
all of metrics for the resources.
This icon appears only if you selected multiple metrics in the providing widget.
Show Metrics Collecting Shows only currently collected metrics for the resources. Click the icon again to
show all metrics.
Search To find a particular metric group, metric instance, or metric, type all or part of its
name in the Search text box, select the type of value you are searching for, and
click this icon.
The only configuration option for the Metric Selector widget is the widget title.
Chapter 4 Using and Configuring Widgets
VMware, Inc. 97