
5.8.5
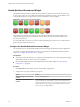
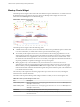
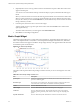
Table Of Contents
- VMware vCenter Operations Manager Getting Started Guide
- Contents
- VMware vCenter Operations Manager Getting Started Guide
- Introducing Custom User Interface Features and Concepts
- Introducing Common Tasks
- Logging In and Using vCenter Operations Manager
- Monitoring Day-to-Day Operations
- Handling Alerts
- Optimizing Your Resources
- Designing Your Workspace
- Working with Dashboards
- Create a Dashboard
- Clone a Dashboard
- Edit a Dashboard
- Delete a Dashboard
- Create a Dashboard Template
- Hide a Dashboard Tab
- Change the Order of Dashboard Tabs
- Delete a Dashboard Template
- Configure Dashboard Switching
- Share a Dashboard
- Stop Sharing a Dashboard for all Users
- Stop Sharing a Dashboard for a Group
- Export a Dashboard
- Import a Dashboard
- vSphere Dashboards
- Working with Widgets
- Working with Dashboards
- Using and Configuring Widgets
- Edit a Widget Configuration
- Supported Widget Interactions
- Configure Widget Interactions
- Advanced Health Tree Widget
- Alerts Widget
- Application Detail Widget
- Application Overview Widget
- Configuration Overview Widget
- Custom Relationship Widget
- Data Collection Results Widget
- Data Distribution Analysis Widget
- Generic Scoreboard Widget
- GEO Widget
- Health Status Widget
- Health Tree Widget
- Health-Workload Scoreboard Widget
- Heat Map Widget
- Mashup Charts Widget
- Metric Graph Widget
- Metric Graph (Rolling View) Widget
- Metric Selector Widget
- Metric Sparklines Widget
- Metric Weather Map Widget
- Resources Widget
- Root Cause Ranking Widget
- Tag Selector Widget
- Text Widget
- Top-N Analysis Widget
- VC Relationship Widget
- VC Relationship (Planning) Widget
- Define Metric Sets for a Widget
- Index

2 (Optional) Select one or more tag values in the list to the left of the List pane to filter the resources that
appear in the List pane.
You can use icons on the toolbar at the top of the list to collapse, expand, and deselect all of the tags in
the list.
When you select more than one value for the same tag, the list includes resources that have either value.
When you select values for two or more tags, the list includes only resources that have all of the values
that you select. When you click the Invert Result icon, the list includes only resources that do not match
the tag values that you select.
3 In the List pane, select the resource to show in the widget.
To find a specific resource, type all or part of the resource name in the Search text box and click the
right angle bracket (>).
The name of the resource that you select appears after Selected Resource.
4 Click OK to save the widget configuration.
Metric Graph Widget
The Metric Graph widget shows a graph of the recent performance, and predicted future performance, of a
metric. The important metrics count, which a vCenter Operations Manager administrator sets, determines
the number of metrics that appear in the Metric Graph widget. The key in the graph indicates the maximum
and minimum points on the line chart.
Figure 4‑13. Metric Graph Widget
The toolbar at the top of the Metric Graph widget contains icons that you can use to change the view of the
graphs.
Table 4‑8. Metric Graph Widget Toolbar Icons
Icon Description
Split Graphs When two or three time periods are selected, this icon shows the values for each
period on a different graph.
Stacked Graph Shows metrics in a stacked graph. This graph is useful for seeing how the total or
sum of the metric values varies over time. Not available in split mode.
Y Axis Shows or hides the Y-axis scale.
Metric Graph Shows or hides the line that connects the data points on the graph.
Trend Line Shows or hides the trend line. The trend line filters out metric noise along the
timeline by plotting each data point relative to the average of its adjoining data
points.
Dynamic Thresholds Shows or hides the dynamic threshold for each metric for the last 24 hours.
VMware vCenter Operations Manager Getting Started Guide
90 VMware, Inc.