
5.8.5
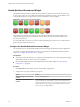
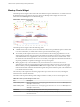
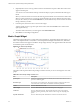
Table Of Contents
- VMware vCenter Operations Manager Getting Started Guide
- Contents
- VMware vCenter Operations Manager Getting Started Guide
- Introducing Custom User Interface Features and Concepts
- Introducing Common Tasks
- Logging In and Using vCenter Operations Manager
- Monitoring Day-to-Day Operations
- Handling Alerts
- Optimizing Your Resources
- Designing Your Workspace
- Working with Dashboards
- Create a Dashboard
- Clone a Dashboard
- Edit a Dashboard
- Delete a Dashboard
- Create a Dashboard Template
- Hide a Dashboard Tab
- Change the Order of Dashboard Tabs
- Delete a Dashboard Template
- Configure Dashboard Switching
- Share a Dashboard
- Stop Sharing a Dashboard for all Users
- Stop Sharing a Dashboard for a Group
- Export a Dashboard
- Import a Dashboard
- vSphere Dashboards
- Working with Widgets
- Working with Dashboards
- Using and Configuring Widgets
- Edit a Widget Configuration
- Supported Widget Interactions
- Configure Widget Interactions
- Advanced Health Tree Widget
- Alerts Widget
- Application Detail Widget
- Application Overview Widget
- Configuration Overview Widget
- Custom Relationship Widget
- Data Collection Results Widget
- Data Distribution Analysis Widget
- Generic Scoreboard Widget
- GEO Widget
- Health Status Widget
- Health Tree Widget
- Health-Workload Scoreboard Widget
- Heat Map Widget
- Mashup Charts Widget
- Metric Graph Widget
- Metric Graph (Rolling View) Widget
- Metric Selector Widget
- Metric Sparklines Widget
- Metric Weather Map Widget
- Resources Widget
- Root Cause Ranking Widget
- Tag Selector Widget
- Text Widget
- Top-N Analysis Widget
- VC Relationship Widget
- VC Relationship (Planning) Widget
- Define Metric Sets for a Widget
- Index

Health-Workload Scoreboard Widget
The Health-Workload Scoreboard widget shows the health or workload score of selected resources. The
icons for each resource are color coded. Green indicates best performance, which is 100 for health or 0 for
workload. Red indicates worst performance, which is 0 for health or 100 for workload.
Figure 4‑11. Health-Workload Scoreboard Widget
The workload score applies only to specific resources monitored through the VMware adapter. If you
configure the widget to show the workload for resources that do not have the workload metric, those
resources have blue icons.
You can double-click a resource icon to show the Resource Detail page for the resource. A dashed red line
appears around a selected resource icon.
Configure the Health-Workload Scoreboard Widget
You can define resources for the Health-Workload Scoreboard widget by editing the widget configuration.
You can also configure other widgets to provide resource selections to the Health-Workload Scoreboard
widget. See “Configure Widget Interactions,” on page 63.
Prerequisites
n
Verify that you have the necessary access rights to perform this task. Your vCenter Operations Manager
administrator can tell you which actions you can perform.
n
Open the Edit Widget window for the Health-Workload Scoreboard widget. See “Edit a Widget
Configuration,” on page 56.
Procedure
1 Set Self Provider to On to define resources in the widget configuration.
2 Configure the image type and metric type options.
Option Action
Select the image to show for each
resource
Select an Image Type option.
Set the metric to show for each
resource
Select a Metric option. If you select Workload, select the attribute to use
for the workload score. If the attribute you select is not collected for the
listed resources, those resources always show blue for unknown. You can
filter the attribute list by typing part of the attribute name and pressing
Enter to list only matching attributes.
VMware vCenter Operations Manager Getting Started Guide
84 VMware, Inc.