
5.8.5
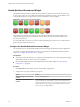
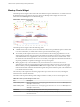
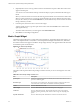
Table Of Contents
- VMware vCenter Operations Manager Getting Started Guide
- Contents
- VMware vCenter Operations Manager Getting Started Guide
- Introducing Custom User Interface Features and Concepts
- Introducing Common Tasks
- Logging In and Using vCenter Operations Manager
- Monitoring Day-to-Day Operations
- Handling Alerts
- Optimizing Your Resources
- Designing Your Workspace
- Working with Dashboards
- Create a Dashboard
- Clone a Dashboard
- Edit a Dashboard
- Delete a Dashboard
- Create a Dashboard Template
- Hide a Dashboard Tab
- Change the Order of Dashboard Tabs
- Delete a Dashboard Template
- Configure Dashboard Switching
- Share a Dashboard
- Stop Sharing a Dashboard for all Users
- Stop Sharing a Dashboard for a Group
- Export a Dashboard
- Import a Dashboard
- vSphere Dashboards
- Working with Widgets
- Working with Dashboards
- Using and Configuring Widgets
- Edit a Widget Configuration
- Supported Widget Interactions
- Configure Widget Interactions
- Advanced Health Tree Widget
- Alerts Widget
- Application Detail Widget
- Application Overview Widget
- Configuration Overview Widget
- Custom Relationship Widget
- Data Collection Results Widget
- Data Distribution Analysis Widget
- Generic Scoreboard Widget
- GEO Widget
- Health Status Widget
- Health Tree Widget
- Health-Workload Scoreboard Widget
- Heat Map Widget
- Mashup Charts Widget
- Metric Graph Widget
- Metric Graph (Rolling View) Widget
- Metric Selector Widget
- Metric Sparklines Widget
- Metric Weather Map Widget
- Resources Widget
- Root Cause Ranking Widget
- Tag Selector Widget
- Text Widget
- Top-N Analysis Widget
- VC Relationship Widget
- VC Relationship (Planning) Widget
- Define Metric Sets for a Widget
- Index

Health Tree Widget
The Health Tree widget shows the section of your resource hierarchy around a resource that you select. The
widget shows all of the parent container resources that hold the resource. If you select a container resource,
the widget shows all of the child resources that the container holds.
Figure 4‑10. Health Tree Widget
Unless you are in Pan or Zoom the view mode, you can point to a resource to show its name and current
health. You can double-click a resource to shift the display to show its parents and children.
If you configure a filter tag for the Health Tree widget, only the parent and child resources that match the
tag appear in the widget. You can double-click a resource to turn off the filter and show all of its parents and
children.
The toolbar at the top of the Health Tree widget contains icons that you can use to change the view.
Table 4‑5. Health Tree Widget Toolbar Icons
Icon Description
Zoom to Fit Changes the size of the resource icons for the best possible fit in the widget.
Pan Click this icon and click and drag the hierarchy to show different parts of the
hierarchy.
Image Map Tooltip Click this icon and point to a resource to show its name and current health.
Zoom the view Click this icon and drag to outline a part of the hierarchy. The display zooms to
show only the outlined section.
Zoom in Zooms in on the hierarchy.
Zoom out Zooms out on the hierarchy.
Reset To Initial Resource If you changed the central resource of the hierarchy, click this icon to return to the
initial resource. Clicking this icon also resets the initial display size.
Resource Detail Select a resource and click this icon to show the Resource Detail page for the
resource.
Show Alerts Select the resource in the hierarchy and click this icon to show alerts for the
resource. Alerts appear in a pop-up window. You can double-click an alert to
view its Alert Summary page.
Display Filtering Criteria Shows the filtering settings for the widget in a pop-up window.
VMware vCenter Operations Manager Getting Started Guide
82 VMware, Inc.