
5.8.5


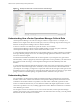
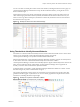
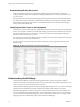
Table Of Contents
- VMware vCenter Operations Manager Getting Started Guide
- Contents
- VMware vCenter Operations Manager Getting Started Guide
- Introducing Custom User Interface Features and Concepts
- Introducing Common Tasks
- Logging In and Using vCenter Operations Manager
- Monitoring Day-to-Day Operations
- Handling Alerts
- Optimizing Your Resources
- Designing Your Workspace
- Working with Dashboards
- Create a Dashboard
- Clone a Dashboard
- Edit a Dashboard
- Delete a Dashboard
- Create a Dashboard Template
- Hide a Dashboard Tab
- Change the Order of Dashboard Tabs
- Delete a Dashboard Template
- Configure Dashboard Switching
- Share a Dashboard
- Stop Sharing a Dashboard for all Users
- Stop Sharing a Dashboard for a Group
- Export a Dashboard
- Import a Dashboard
- vSphere Dashboards
- Working with Widgets
- Working with Dashboards
- Using and Configuring Widgets
- Edit a Widget Configuration
- Supported Widget Interactions
- Configure Widget Interactions
- Advanced Health Tree Widget
- Alerts Widget
- Application Detail Widget
- Application Overview Widget
- Configuration Overview Widget
- Custom Relationship Widget
- Data Collection Results Widget
- Data Distribution Analysis Widget
- Generic Scoreboard Widget
- GEO Widget
- Health Status Widget
- Health Tree Widget
- Health-Workload Scoreboard Widget
- Heat Map Widget
- Mashup Charts Widget
- Metric Graph Widget
- Metric Graph (Rolling View) Widget
- Metric Selector Widget
- Metric Sparklines Widget
- Metric Weather Map Widget
- Resources Widget
- Root Cause Ranking Widget
- Tag Selector Widget
- Text Widget
- Top-N Analysis Widget
- VC Relationship Widget
- VC Relationship (Planning) Widget
- Define Metric Sets for a Widget
- Index

Figure 1‑1. Example of Resources on the Environment Overview Page
Understanding How vCenter Operations Manager Collects Data
vCenter Operations Manager can collect several types of data for a single resource. For example, for a
database server it might receive data on free disk space, CPU use, and average response time. Each type of
data that vCenter Operations Manager collects is called an attribute.
A metric is an instance of an attribute for a particular resource. For each metric,
vCenter Operations Manager collects and stores multiple readings over time. Each piece of data that
vCenter Operations Manager collects is called a metric observation or value.
A vCenter Operations Manager administrator creates attribute packages to define combinations of attributes
and assigns attribute packages to resources. An attribute package specifies the attributes to collect for the
resource to which it is assigned.
An administrator identifies the attributes that are most important in your enterprise as key performance
indicators (KPIs). A KPI is a high-priority metric that might indicate a severe problem in your infrastructure
if it exceeds its normal value range. vCenter Operations Manager treats KPIs differently from other
attributes.
A vCenter Operations Manager administrator might also create super metrics and super metric packages. A
super metric is useful when a single metric cannot tell you what you need to know about the behavior of
your enterprise. For example, you might have a super metric that tracks the average free disk space for all of
the database servers in your enterprise by averaging the free disk space metric for all servers. A super metric
package is similar to an attribute package, except that it defines combinations of super metrics.
Understanding Alerts
For each attribute, vCenter Operations Manager maintains thresholds of normal behavior and generates
anomalies when a metric violates a threshold. If vCenter Operations Manager determines that the current
combination of anomalies indicates a real problem, or if a KPI violates a threshold, it generates an alert.
An alert is a notification that informs you of an abnormal condition that might require attention. An alert
can describe a problem in a resource, including applications and tiers. Different combinations of conditions
cause different types of alerts.
For example, if CPU use for all of the servers in a tier exceeds a threshold, vCenter Operations Manager
generates an anomaly for each out-of-threshold metric value and sends an alert to notify you of the problem.
The alert lists all of the anomalies for each metric.
VMware vCenter Operations Manager Getting Started Guide
8 VMware, Inc.