
5.8.5
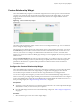
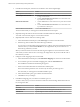
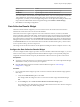
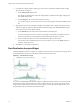
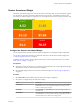
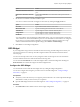
Table Of Contents
- VMware vCenter Operations Manager Getting Started Guide
- Contents
- VMware vCenter Operations Manager Getting Started Guide
- Introducing Custom User Interface Features and Concepts
- Introducing Common Tasks
- Logging In and Using vCenter Operations Manager
- Monitoring Day-to-Day Operations
- Handling Alerts
- Optimizing Your Resources
- Designing Your Workspace
- Working with Dashboards
- Create a Dashboard
- Clone a Dashboard
- Edit a Dashboard
- Delete a Dashboard
- Create a Dashboard Template
- Hide a Dashboard Tab
- Change the Order of Dashboard Tabs
- Delete a Dashboard Template
- Configure Dashboard Switching
- Share a Dashboard
- Stop Sharing a Dashboard for all Users
- Stop Sharing a Dashboard for a Group
- Export a Dashboard
- Import a Dashboard
- vSphere Dashboards
- Working with Widgets
- Working with Dashboards
- Using and Configuring Widgets
- Edit a Widget Configuration
- Supported Widget Interactions
- Configure Widget Interactions
- Advanced Health Tree Widget
- Alerts Widget
- Application Detail Widget
- Application Overview Widget
- Configuration Overview Widget
- Custom Relationship Widget
- Data Collection Results Widget
- Data Distribution Analysis Widget
- Generic Scoreboard Widget
- GEO Widget
- Health Status Widget
- Health Tree Widget
- Health-Workload Scoreboard Widget
- Heat Map Widget
- Mashup Charts Widget
- Metric Graph Widget
- Metric Graph (Rolling View) Widget
- Metric Selector Widget
- Metric Sparklines Widget
- Metric Weather Map Widget
- Resources Widget
- Root Cause Ranking Widget
- Tag Selector Widget
- Text Widget
- Top-N Analysis Widget
- VC Relationship Widget
- VC Relationship (Planning) Widget
- Define Metric Sets for a Widget
- Index

Generic Scoreboard Widget
The Generic Scoreboard widget shows the current value for each metric that you select. Each metric appears
in a separate box. The value of the metric determines the color of the box. You define the values for each
color when you edit the widget. If you point to a box, the widget shows the source resource and metric data.
Figure 4‑8. Generic Scoreboard Widget
Configure the Generic Scoreboard Widget
You can select the metrics that the Generic Scoreboard widget shows by editing the widget configuration.
You can also configure other widgets to provide metric selections to the Generic Scoreboard widget. See
“Configure Widget Interactions,” on page 63.
To define a fixed set of metrics for the widget to draw when you select a particular resource, see “Define
Metric Sets for a Widget,” on page 113.
Prerequisites
n
Verify that you have the necessary access rights to perform this task. Your vCenter Operations Manager
administrator can tell you which actions you can perform.
n
Open the Edit Widget window for the Generic Scoreboard widget. See “Edit a Widget Configuration,”
on page 56.
Procedure
1 Set Self Provider to On to define metric selections in the widget configuration.
2 Set options to configure the layout of the metric display.
Option Description
Layout Mode
Select Fixed Size to define the height for each metric box in Box Height, or
Fixed View to have vCenter Operations Manager size the boxes so all
metrics fit in the displayed widget.
Box Height
If Layout Mode is set to Fixed Size, this value is the height, in pixels, of
each metric box.
Box Columns
Number of boxes to include in each row, from 2 to 10. If Layout Mode is
set to Fixed View, vCenter Operations Manager changes the box width as
needed to fit this many columns in the widget width.
Chapter 4 Using and Configuring Widgets
VMware, Inc. 77