
5.8.5
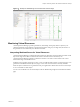
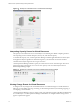
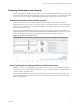
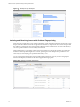
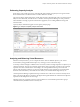

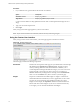
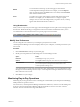
Table Of Contents
- VMware vCenter Operations Manager Getting Started Guide
- Contents
- VMware vCenter Operations Manager Getting Started Guide
- Introducing Custom User Interface Features and Concepts
- Introducing Common Tasks
- Logging In and Using vCenter Operations Manager
- Monitoring Day-to-Day Operations
- Handling Alerts
- Optimizing Your Resources
- Designing Your Workspace
- Working with Dashboards
- Create a Dashboard
- Clone a Dashboard
- Edit a Dashboard
- Delete a Dashboard
- Create a Dashboard Template
- Hide a Dashboard Tab
- Change the Order of Dashboard Tabs
- Delete a Dashboard Template
- Configure Dashboard Switching
- Share a Dashboard
- Stop Sharing a Dashboard for all Users
- Stop Sharing a Dashboard for a Group
- Export a Dashboard
- Import a Dashboard
- vSphere Dashboards
- Working with Widgets
- Working with Dashboards
- Using and Configuring Widgets
- Edit a Widget Configuration
- Supported Widget Interactions
- Configure Widget Interactions
- Advanced Health Tree Widget
- Alerts Widget
- Application Detail Widget
- Application Overview Widget
- Configuration Overview Widget
- Custom Relationship Widget
- Data Collection Results Widget
- Data Distribution Analysis Widget
- Generic Scoreboard Widget
- GEO Widget
- Health Status Widget
- Health Tree Widget
- Health-Workload Scoreboard Widget
- Heat Map Widget
- Mashup Charts Widget
- Metric Graph Widget
- Metric Graph (Rolling View) Widget
- Metric Selector Widget
- Metric Sparklines Widget
- Metric Weather Map Widget
- Resources Widget
- Root Cause Ranking Widget
- Tag Selector Widget
- Text Widget
- Top-N Analysis Widget
- VC Relationship Widget
- VC Relationship (Planning) Widget
- Define Metric Sets for a Widget
- Index

Table 2‑1. Default Health Color Ranges
Color Range
Green 76 to 100
Yellow 51 to 75
Orange 26 to 50
Red 1 to 25
Blue 0
View an Overview of Resource Health
You can view a graphical representation of the health of all vCenter Operations Manager resources that
have a specific resource tag value on the Environment Overview page.
Procedure
1 Select Environment > Environment Overview to view the Environment Overview page.
2 Select one or more resource tag values in the left pane.
3 Click the Group tab.
The Group tab shows a colored icon that represents the current health of each resource that has the
selected tag value. If you point to a colored icon, a tooltip appears that describes the resource that the
icon represents.
Option Action
View the health icons for any time
in the past six hours
Move the slider at the bottom of the Group tab to the left. The slider moves
in five-minute increments.
View detailed information for a
resource
Click the icon for the resource and click the Show Detail icon on the
toolbar.
Identify Health Problems for a Specific Resource
You can use the Resource Detail page to identify health problems for a specific resource. For a global
resource, the Resource Detail page contains information about the current state of the resource, its metrics,
and its place in the resource tree. For a virtual resource, the Resource Detail page shows information about
the main performance characteristics, key metrics, and events for the virtual resource.
Procedure
1 Select Environment > Environment Overview.
2 (Optional) In the left pane, expand a resource tag and select a tag value that is assigned to the resource.
Selecting a tag value can shorten the resource list and make it easier to find a specific resource.
3 Select the resource on the List tab.
4 Click the Show Detail icon.
The Resource Detail page appears for the resource.
VMware vCenter Operations Manager Getting Started Guide
20 VMware, Inc.