
5.8.5
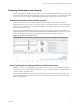
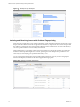
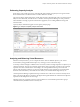

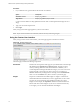
Table Of Contents
- VMware vCenter Operations Manager Getting Started Guide
- Contents
- VMware vCenter Operations Manager Getting Started Guide
- Introducing Custom User Interface Features and Concepts
- Introducing Common Tasks
- Logging In and Using vCenter Operations Manager
- Monitoring Day-to-Day Operations
- Handling Alerts
- Optimizing Your Resources
- Designing Your Workspace
- Working with Dashboards
- Create a Dashboard
- Clone a Dashboard
- Edit a Dashboard
- Delete a Dashboard
- Create a Dashboard Template
- Hide a Dashboard Tab
- Change the Order of Dashboard Tabs
- Delete a Dashboard Template
- Configure Dashboard Switching
- Share a Dashboard
- Stop Sharing a Dashboard for all Users
- Stop Sharing a Dashboard for a Group
- Export a Dashboard
- Import a Dashboard
- vSphere Dashboards
- Working with Widgets
- Working with Dashboards
- Using and Configuring Widgets
- Edit a Widget Configuration
- Supported Widget Interactions
- Configure Widget Interactions
- Advanced Health Tree Widget
- Alerts Widget
- Application Detail Widget
- Application Overview Widget
- Configuration Overview Widget
- Custom Relationship Widget
- Data Collection Results Widget
- Data Distribution Analysis Widget
- Generic Scoreboard Widget
- GEO Widget
- Health Status Widget
- Health Tree Widget
- Health-Workload Scoreboard Widget
- Heat Map Widget
- Mashup Charts Widget
- Metric Graph Widget
- Metric Graph (Rolling View) Widget
- Metric Selector Widget
- Metric Sparklines Widget
- Metric Weather Map Widget
- Resources Widget
- Root Cause Ranking Widget
- Tag Selector Widget
- Text Widget
- Top-N Analysis Widget
- VC Relationship Widget
- VC Relationship (Planning) Widget
- Define Metric Sets for a Widget
- Index

Analyzing Performance and Capacity
With vCenter Operations Manager forensics features, you can analyze the performance and capacity of your
resources and use this information to balance the resources in your environment. Forensics features include
cross-silo analysis, top-n analysis, the problem fingerprint library, capacity analysis, and VC analysis.
Examining Anomalies with Cross-Silo Analysis
With cross-silo analysis, you can examine graphs that show the number of anomalies over time for
particular resources. You can zoom in on a graph to focus on a specific period of time, such as immediately
before an alert. You can also click on a location in a graph to see a ranking of the likely root causes for the
anomalies at that specific time.
Cross-silo analysis information appears on the Cross-Silo Analysis page. For applications, the anomaly
graph includes a line that shows the internally determined 90 percent threshold. If the number of anomalies
exceeds this threshold, vCenter Operations Manager generates an early warning Smart Alert.
Figure 1‑8. Example of Cross-Silo Analysis
Using Top-N Analysis to Determine Best and Worst Performers
With top-n analysis, you can identify the top or bottom resources, metrics, or alerts in selected categories,
such as the five most or least healthy resources in a tier. You can also select the resource tag and time frame
to analyze and the categories to show.
Top-n analysis information appears on the Top-N Analysis page and in the Top-N Analysis widget. The
Resource Health pane shows the health of the resource. The information that you select in the Tools pane
appears in the right pane.
Chapter 1 Introducing Custom User Interface Features and Concepts
VMware, Inc. 13