
5.8.5
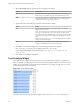
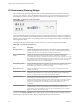
Table Of Contents
- VMware vCenter Operations Manager Getting Started Guide
- Contents
- VMware vCenter Operations Manager Getting Started Guide
- Introducing Custom User Interface Features and Concepts
- Introducing Common Tasks
- Logging In and Using vCenter Operations Manager
- Monitoring Day-to-Day Operations
- Handling Alerts
- Optimizing Your Resources
- Designing Your Workspace
- Working with Dashboards
- Create a Dashboard
- Clone a Dashboard
- Edit a Dashboard
- Delete a Dashboard
- Create a Dashboard Template
- Hide a Dashboard Tab
- Change the Order of Dashboard Tabs
- Delete a Dashboard Template
- Configure Dashboard Switching
- Share a Dashboard
- Stop Sharing a Dashboard for all Users
- Stop Sharing a Dashboard for a Group
- Export a Dashboard
- Import a Dashboard
- vSphere Dashboards
- Working with Widgets
- Working with Dashboards
- Using and Configuring Widgets
- Edit a Widget Configuration
- Supported Widget Interactions
- Configure Widget Interactions
- Advanced Health Tree Widget
- Alerts Widget
- Application Detail Widget
- Application Overview Widget
- Configuration Overview Widget
- Custom Relationship Widget
- Data Collection Results Widget
- Data Distribution Analysis Widget
- Generic Scoreboard Widget
- GEO Widget
- Health Status Widget
- Health Tree Widget
- Health-Workload Scoreboard Widget
- Heat Map Widget
- Mashup Charts Widget
- Metric Graph Widget
- Metric Graph (Rolling View) Widget
- Metric Selector Widget
- Metric Sparklines Widget
- Metric Weather Map Widget
- Resources Widget
- Root Cause Ranking Widget
- Tag Selector Widget
- Text Widget
- Top-N Analysis Widget
- VC Relationship Widget
- VC Relationship (Planning) Widget
- Define Metric Sets for a Widget
- Index

VC Relationship Widget
The VC Relationship widget provides performance and relationship data for objects in your virtual
environment. It uses badges to represent derived metrics and give you a high-level, broad view of the
performance and condition of your virtual environment.
Figure 4‑21. VC Relationship Widget
Objects appear in hierarchy levels. If a badge does not have a green status, the object has a potential
problem. You can double-click a badge to see the Resource Detail page for that object.
The toolbar at the top left of the widget contains icons that you can use to change the object display.
Table 4‑18. VC Relationship Widget Icons
Icon Description
Show Health Values Changes the object display to show health ratings. The health rating gives you a quick
overview of the current state of a resource. vCenter Operations Manager examines internally
generated metrics and uses its proprietary analytics formulas to determine the health rating.
Internally generated metrics include the total number of alerts and anomalies and the
number of active alerts.
Show Workload Values Changes the object display to show workload scores. The workload score is a combination of
the metrics that show the demand on an object. These metrics include CPU use and memory
use. If an object has a workload score that is greater than 100, you might need to allocate
more resources to the object or move some tasks to other objects.
Show Anomalies Values Changes the object display to show anomalies scores. The anomalies score indicates how
abnormal an object's behavior is based on the object's historical metrics. A low anomalies
score indicates that an object is behaving in accordance with its established historical
parameters. A high number of anomalies typically indicates a problem or situation that
requires your attention.
Show Faults Values Changes the object display to show fault scores. The faults score indicates the degree of
problems that the object is experiencing. It includes events such as loss of redundancy in
NICs or HBAs, memory checksum errors, HA failover problems, and CIM events.
You can use the STATUS FILTER buttons to filter objects by state. In large inventories, filtering objects by
state can help you quickly find objects that have degraded performance characteristics.
You can use the VC FILTER drop-down menu to filter objects by vCenter Server system. If you select a
specific vCenter Server system, the widget shows only objects for that vCenter Server system. If you select
ALL, the widget shows objects for all vCenter Server systems in your environment.
With the SORT BY drop-down menu, you can sort the object display by object name or value.
The only configuration options for the VC Relationship widget are the widget title and widget refresh
settings.
Chapter 4 Using and Configuring Widgets
VMware, Inc. 111