
5.8.5
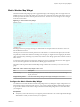
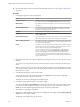
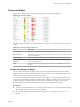
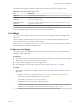
Table Of Contents
- VMware vCenter Operations Manager Getting Started Guide
- Contents
- VMware vCenter Operations Manager Getting Started Guide
- Introducing Custom User Interface Features and Concepts
- Introducing Common Tasks
- Logging In and Using vCenter Operations Manager
- Monitoring Day-to-Day Operations
- Handling Alerts
- Optimizing Your Resources
- Designing Your Workspace
- Working with Dashboards
- Create a Dashboard
- Clone a Dashboard
- Edit a Dashboard
- Delete a Dashboard
- Create a Dashboard Template
- Hide a Dashboard Tab
- Change the Order of Dashboard Tabs
- Delete a Dashboard Template
- Configure Dashboard Switching
- Share a Dashboard
- Stop Sharing a Dashboard for all Users
- Stop Sharing a Dashboard for a Group
- Export a Dashboard
- Import a Dashboard
- vSphere Dashboards
- Working with Widgets
- Working with Dashboards
- Using and Configuring Widgets
- Edit a Widget Configuration
- Supported Widget Interactions
- Configure Widget Interactions
- Advanced Health Tree Widget
- Alerts Widget
- Application Detail Widget
- Application Overview Widget
- Configuration Overview Widget
- Custom Relationship Widget
- Data Collection Results Widget
- Data Distribution Analysis Widget
- Generic Scoreboard Widget
- GEO Widget
- Health Status Widget
- Health Tree Widget
- Health-Workload Scoreboard Widget
- Heat Map Widget
- Mashup Charts Widget
- Metric Graph Widget
- Metric Graph (Rolling View) Widget
- Metric Selector Widget
- Metric Sparklines Widget
- Metric Weather Map Widget
- Resources Widget
- Root Cause Ranking Widget
- Tag Selector Widget
- Text Widget
- Top-N Analysis Widget
- VC Relationship Widget
- VC Relationship (Planning) Widget
- Define Metric Sets for a Widget
- Index

Table 4‑15. Root Cause Ranking Widget Toolbar Icons
Icon Description
Auto Refresh Refreshes the widget data.
Show Bar Details Opens a new window that shows detailed information about the threshold violations
that contributed to the selected root cause.
Perform Interaction Shows the first five alarming metrics for the resource of the selected symptom in
either the Metric Graph or Metric Sparklines widget. You must include either the
Metric Graph widget or the Metric Sparklines widgets on the dashboard and set it to
receive data from the Root Cause widget to use this feature.
Change mode Switches between Resource mode and Symptom mode.
You can double-click a root cause symptom to open a pop-up window that lists the individual threshold
violations that comprise the symptom. You can then click the Copy to Clipboard button to copy the list to
the clipboard. You might want to use this feature if you are opening a problem ticket or sending an email
message about the alert. To see the Dynamic Dashboard for a root cause resource, select it in the pop-up
window and click the Dynamic Dashboard button.
Configure the Root Cause Ranking Widget
You can configure the Root Cause Ranking widget to show specific resources.
You can also configure other widgets to provide resources to the Root Cause Ranking widget. See
“Configure Widget Interactions,” on page 63.
Prerequisites
n
Verify that you have the necessary access rights to perform this task. Your vCenter Operations Manager
administrator can tell you which actions you can perform.
n
Open the Edit Widget window for the Root Cause Ranking widget. See “Edit a Widget Configuration,”
on page 56.
Procedure
1 Set Self Provider to On to define resources in the widget configuration.
2 Select a Bars Show option to specify whether to show bars for symptoms or resources.
If you select Resources, you can choose how many bars to show.
3 Select the tag values to include in the Select which tags to filter list.
You can use icons on the toolbar at the top of the Select which tags to filter pane to collapse, expand,
and deselect all of the tags in the list.
When you select more than one value for the same tag, the widget includes resources that have either
value. When you select values for two or more tags, the widget includes resources that have all of the
selected values.
4 Click OK to save the widget configuration.
Tag Selector Widget
The Tag Selector widget lists all defined resource tags and tag values. You can select one or more tag values
to change the information that appears in the Alerts, Configuration Overview, Health Status, Root Cause
Ranking, and Health Tree widgets.
If you select more than one value for the same tag, the widget includes resources that have either value. If
you select values for two or more tags, the widget includes only resources that have all of the tags you
select.
VMware vCenter Operations Manager Getting Started Guide
106 VMware, Inc.