
5.8.5
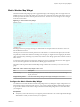
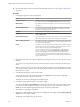
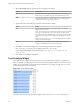
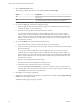
Table Of Contents
- VMware vCenter Operations Manager Getting Started Guide
- Contents
- VMware vCenter Operations Manager Getting Started Guide
- Introducing Custom User Interface Features and Concepts
- Introducing Common Tasks
- Logging In and Using vCenter Operations Manager
- Monitoring Day-to-Day Operations
- Handling Alerts
- Optimizing Your Resources
- Designing Your Workspace
- Working with Dashboards
- Create a Dashboard
- Clone a Dashboard
- Edit a Dashboard
- Delete a Dashboard
- Create a Dashboard Template
- Hide a Dashboard Tab
- Change the Order of Dashboard Tabs
- Delete a Dashboard Template
- Configure Dashboard Switching
- Share a Dashboard
- Stop Sharing a Dashboard for all Users
- Stop Sharing a Dashboard for a Group
- Export a Dashboard
- Import a Dashboard
- vSphere Dashboards
- Working with Widgets
- Working with Dashboards
- Using and Configuring Widgets
- Edit a Widget Configuration
- Supported Widget Interactions
- Configure Widget Interactions
- Advanced Health Tree Widget
- Alerts Widget
- Application Detail Widget
- Application Overview Widget
- Configuration Overview Widget
- Custom Relationship Widget
- Data Collection Results Widget
- Data Distribution Analysis Widget
- Generic Scoreboard Widget
- GEO Widget
- Health Status Widget
- Health Tree Widget
- Health-Workload Scoreboard Widget
- Heat Map Widget
- Mashup Charts Widget
- Metric Graph Widget
- Metric Graph (Rolling View) Widget
- Metric Selector Widget
- Metric Sparklines Widget
- Metric Weather Map Widget
- Resources Widget
- Root Cause Ranking Widget
- Tag Selector Widget
- Text Widget
- Top-N Analysis Widget
- VC Relationship Widget
- VC Relationship (Planning) Widget
- Define Metric Sets for a Widget
- Index

Metric Weather Map Widget
The Metric Weather Map widget provides a graphical display of the changing values of a single metric for
multiple resources over time. The widget uses colored icons to represent each value of the metric. Each icon
location represents the metric value for particular resources. The color of an icon changes to show changes
in the value of the metric.
Figure 4‑17. Metric Weather Map Widget
Watching how the map changes can help you understand how the performance of the metric varies over
time for different resources.
The map does not show the real-time performance of the metrics. You select the time period, how fast the
map refreshes, and the interval between readings. For example, you might have the widget play the metric
values for the last day, refreshing every half second, and have each change represent five minute's worth of
metric values.
To view the resource that an icon represents, click the resource. A hyperlink of the resource name appears.
You can click the hyperlink to show the Resource Detail page for the resource.
The toolbar at the top of the Metric Weather Map widget contains the icons that you can use to view the
graph.
Table 4‑13. Metric Weather Map Widget Toolbar Icons
Icon Description
Pause and Play Start or stop the display. The icon remains in the same state if you leave the widget
display and return.
Display Filtering Criteria View the current settings settings for the widget, including the current metric.
Configure the Metric Weather Map Widget
You define the metric that the Metric Weather Map widget shows by editing the widget configuration. You
must edit the widget to select the metric to show. You cannot configure the Metric Weather Map widget to
accept a metric selection from another widget. The Metric Weather Map widget does not show data until
you configure it.
Prerequisites
n
Verify that you have the necessary access rights to perform this task. Your vCenter Operations Manager
administrator can tell you which actions you can perform.
Chapter 4 Using and Configuring Widgets
VMware, Inc. 101