
5.8.5


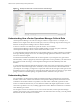
Table Of Contents
- VMware vCenter Operations Manager Getting Started Guide
- Contents
- VMware vCenter Operations Manager Getting Started Guide
- Introducing Custom User Interface Features and Concepts
- Introducing Common Tasks
- Logging In and Using vCenter Operations Manager
- Monitoring Day-to-Day Operations
- Handling Alerts
- Optimizing Your Resources
- Designing Your Workspace
- Working with Dashboards
- Create a Dashboard
- Clone a Dashboard
- Edit a Dashboard
- Delete a Dashboard
- Create a Dashboard Template
- Hide a Dashboard Tab
- Change the Order of Dashboard Tabs
- Delete a Dashboard Template
- Configure Dashboard Switching
- Share a Dashboard
- Stop Sharing a Dashboard for all Users
- Stop Sharing a Dashboard for a Group
- Export a Dashboard
- Import a Dashboard
- vSphere Dashboards
- Working with Widgets
- Working with Dashboards
- Using and Configuring Widgets
- Edit a Widget Configuration
- Supported Widget Interactions
- Configure Widget Interactions
- Advanced Health Tree Widget
- Alerts Widget
- Application Detail Widget
- Application Overview Widget
- Configuration Overview Widget
- Custom Relationship Widget
- Data Collection Results Widget
- Data Distribution Analysis Widget
- Generic Scoreboard Widget
- GEO Widget
- Health Status Widget
- Health Tree Widget
- Health-Workload Scoreboard Widget
- Heat Map Widget
- Mashup Charts Widget
- Metric Graph Widget
- Metric Graph (Rolling View) Widget
- Metric Selector Widget
- Metric Sparklines Widget
- Metric Weather Map Widget
- Resources Widget
- Root Cause Ranking Widget
- Tag Selector Widget
- Text Widget
- Top-N Analysis Widget
- VC Relationship Widget
- VC Relationship (Planning) Widget
- Define Metric Sets for a Widget
- Index

Understanding KPI Alert Generation
When a KPI violates a threshold, vCenter Operations Manager always generates an alert. When they
configure attribute packages, vCenter Operations Manager administrators can identify any attribute for any
resource as a KPI.
The type of alert that vCenter Operations Manager generates depends on the type of threshold that the KPI
uses. When a KPI violates an internally calculated dynamic threshold, vCenter Operations Manager sends a
Smart KPI Breach alert. When a KPI violates a user-defined hard threshold, vCenter Operations Manager
sends a Classic KPI HT Breach alert.
Identifying the Root Causes of Alert Symptoms
The root cause of an alert is the condition or symptom that was the first step in the chain of events that led to
the alert. For example, a slowdown in network traffic through a particular router could lead to an increased
time per transaction for users of your Web site, which in turn could cause vCenter Operations Manager to
generate an alert for the Web server resource.
For each alert, vCenter Operations Manager lists the most likely root causes of the symptoms that caused the
alert and ranks the causes in order of importance.
You can view root causes in the Root Cause column on the Alerts Overview page and in the Root Cause
Ranking widget.
Figure 1‑4. Example of Root Causes on the Alerts Overview Page
Understanding Health Ratings
vCenter Operations Manager examines internally generated metrics and uses its proprietary analytics
formulas to determine an overall health rating for a resource. The health rating, which ranges from 0 to 100,
gives you a quick overview of the current state of a resource.
vCenter Operations Manager generates and stores internally generated metrics for every resource. Internally
generated metrics include the total number of alerts and anomalies and the number of active alerts.
The health rating appears as a numeric rating and as a colored indicator in the Custom user interface. The
color is based on the range of the health rating. You can view the health rating for a resource anywhere that
a resource is listed and in the Health widget. For resources that VMware vCenter Server™ manages, health
ratings appear in the VC Relationship widget and on the Resource Detail page.
VMware vCenter Operations Manager Getting Started Guide
10 VMware, Inc.